Hi, what are you looking for?
Stock
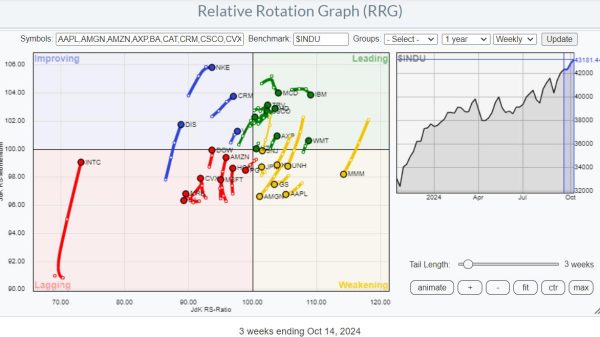
In this week’s RRG video, I shared my concerns about the current market conditions. The sector rotation model and current sector rotation, as we...
Stock
Walt Disney Co. (DIS) has struggled as a business over the past few years and isn’t on many investors’ radars these days. However, Disney...
Stock
When the market is rallying in full swing, it can sometimes be difficult to select which stocks, among the hundreds, might present the best...
Stock
At DecisionPoint we track intermediate-term and long-term BUY/SELL signals on twenty-six market, sector, and industry group indexes. The long-term BUY signals are based upon...
Stock
In this video from StockCharts TV, Julius dives in to the sector rotation model, trying to find any alignment between theoretical and real-life rotations...
Stock
In this exclusive StockCharts TV video, Joe shares the MACD downside crossover signal and explains the different ways it can play out when it...
Stock
Airline stocks had a strong day, with United Airlines (UAL), American Airlines (AAL), and Delta Airlines (DAL) posting strong gains. The main reason for...
Stock
At some point, this raging and relentless bull market has to slow down. Right?!? But as you’ll see from a quick review of three...
Stock
Semiconductors sold off on Tuesday, crushing the Technology sector. But the Real Estate sector didn’t suffer a similar fate; in fact, it was the...
Stock
When Wall Street rings its opening bell, there are two things you need to do to start your day: Get the big picture on...


