Stock
Here are some charts that reflect our areas of focus this week at TrendInvestorPro. SPY and QQQ are leading the market, but the tech...

Hi, what are you looking for?

GMS stock jumps 29% on takeover interest from Home Depot, QXO, analysts raise PTs

Japan’s rice price surge: what’s driving it and why it could spark a political crisis

Foxconn and Nvidia to deploy humanoid robots in AI server factory: report

US stocks climb higher at open: Dow jones jumps 150 pts, Nasdaq up 0.6%

Apollo backs £4.5bn loan for delayed Hinkley Point C nuclear plant

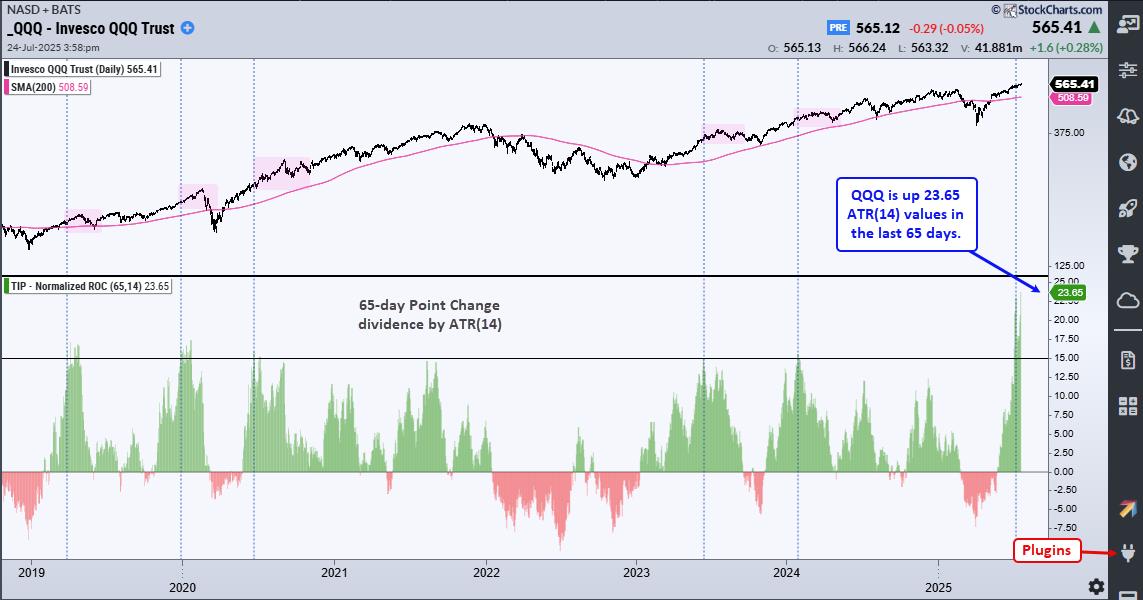
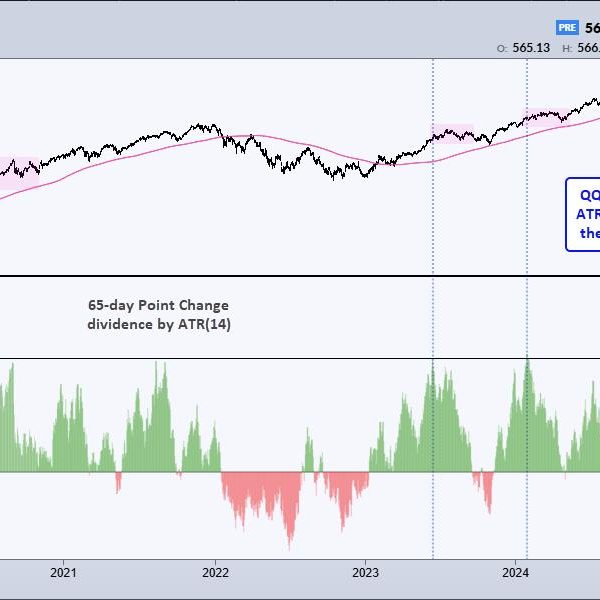
Chart Mania – 23 ATR Move in QQQ – Metals Lead 2025 – XLV Oversold – XLU Breakout – ITB Moment of Truth

S&P 500 Breaking Out Again: What This Means for Your Portfolio

Momentum Leaders Are Rotating — Here’s How to Find Them

Is META Breaking Out or Breaking Down?

A Wild Ride For the History Books: 2025 Mid-Year Recap

Driving the New Era of AI and IoT with Powercast’s One-Stop Shop for Wireless Power Solutions

Successful Launch of 11 Satellites – Geespace Completes Fourth Orbital Deployment of GEESATCOM

Rosenberger Telematics GmbH and Volkswagen Group Info Services AG enter into partnership for fleet data integration

Overlooking Total Cost of IoT Ownership Risks Millions in Hidden Costs, Eseye Report Warns

How Telematics Is Reshaping Transportation

Zelenskyy agrees to Trump-Putin meeting without cease-fire, but will Kremlin dictator go along?
Trump moves to broker Putin-Zelenskyy meeting following DC peace talks
Bondi, Patel tap Missouri AG as additional FBI co-deputy director alongside Bongino
Trump: Europe will ‘take a lot of the burden’ in providing security guarantees for Ukraine
Comer, Crockett clash over Barr’s Epstein testimony as ex-Trump AG ends four-hour House grilling
Here are some charts that reflect our areas of focus this week at TrendInvestorPro. SPY and QQQ are leading the market, but the tech...


The S&P 500 ($SPX) just logged its fifth straight trading box breakout, which means that, of the five trading ranges the index has experienced...

Is the market’s next surge already underway? Find out with Tom Bowley’s breakdown of where the money is flowing now and how you can...
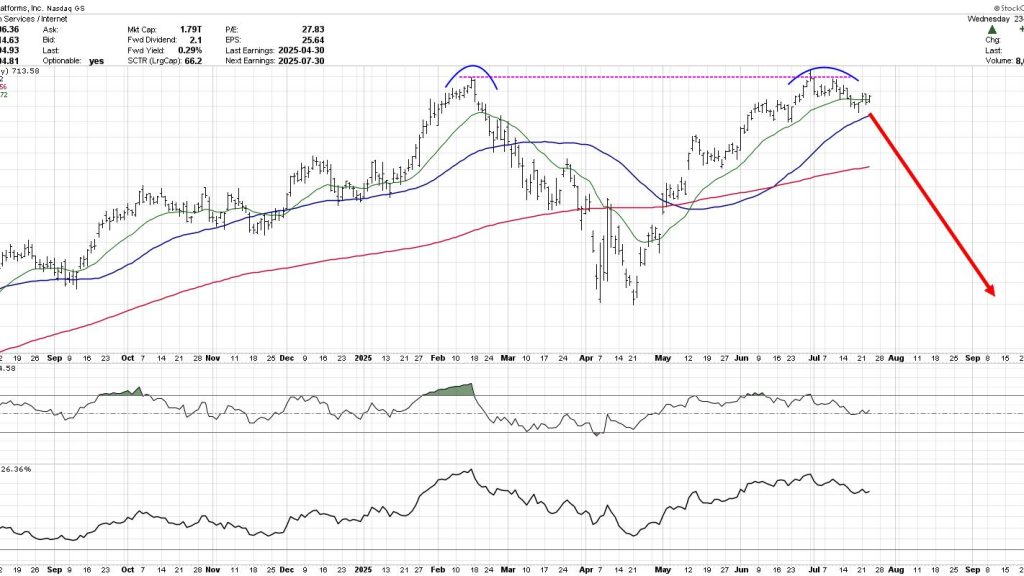
The chart of Meta Platforms, Inc. (META) has completed a roundtrip from the February high around $740 to the April low at $480 and...
Markets don’t usually hit record highs, risk falling into bearish territory, and spring back to new highs within six months. But that’s what happened...
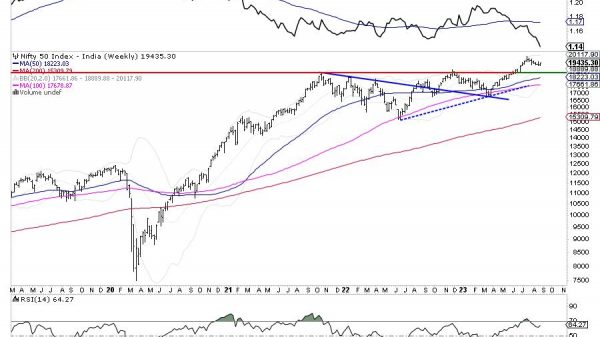
The past five sessions of the week saw the Indian equities trading in a defined and narrower range. The first four sessions were seen...
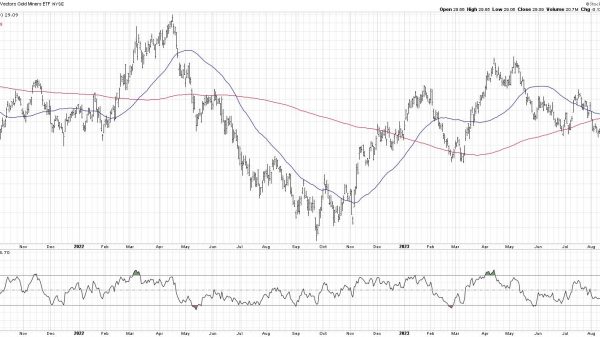
I love the seasonality information that StockCharts.com provides. It’s important to keep in mind that seasonal tendencies are secondary indicators. I don’t buy and...
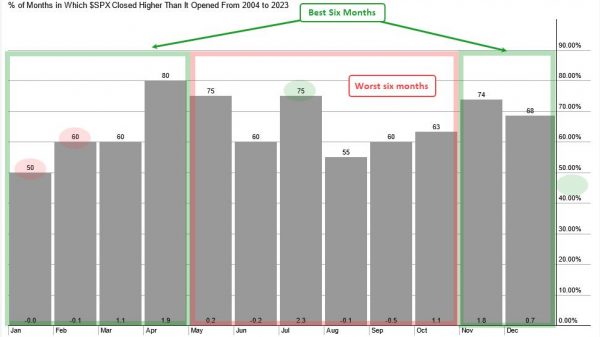
According to the Stock Trader’s Almanac, the best six-month period runs from November to April. The worst six-month period runs from May to October....
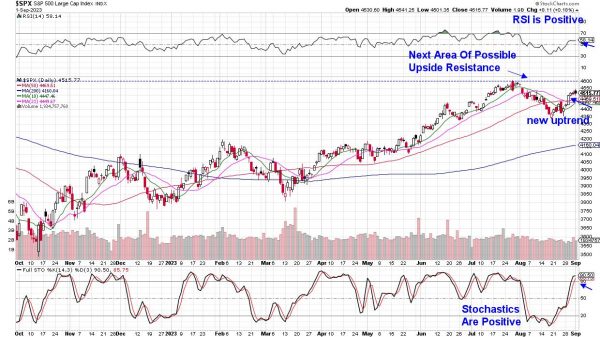
Last week, the broader markets regained their uptrend, with the S&P 500 and Nasdaq Indexes both closing above their key 50-day moving averages on...
Novice investors usually go on a “Holy Grail quest” early on, reading books and watching videos and searching for that elusive one indicator to...


In this episode of StockCharts TV‘s The MEM Edge, Mary Ellen reviews the new uptrend in the markets and shares where the current strength...

On this week’s edition of StockCharts TV‘s StockCharts in Focus, Grayson walks you through a “bottom-up” stock-picking approach that he uses daily on StockCharts,...


The much-awaited August jobs report was released on Friday. While it came in higher than estimates—187K vs. 170K jobs created—there were other areas of...

In this edition of StockCharts TV‘s The Final Bar, Dave wraps the market week with a discussion of higher interest rates, their implication for...

GoNoGo Charts help investors retain an objective evidence-based view on what is actually happening in the markets, and this week has shown the weight...