Stock
Here are some charts that reflect our areas of focus this week at TrendInvestorPro. SPY and QQQ are leading the market, but the tech...

Hi, what are you looking for?

GMS stock jumps 29% on takeover interest from Home Depot, QXO, analysts raise PTs

Japan’s rice price surge: what’s driving it and why it could spark a political crisis

Foxconn and Nvidia to deploy humanoid robots in AI server factory: report

US stocks climb higher at open: Dow jones jumps 150 pts, Nasdaq up 0.6%

Apollo backs £4.5bn loan for delayed Hinkley Point C nuclear plant

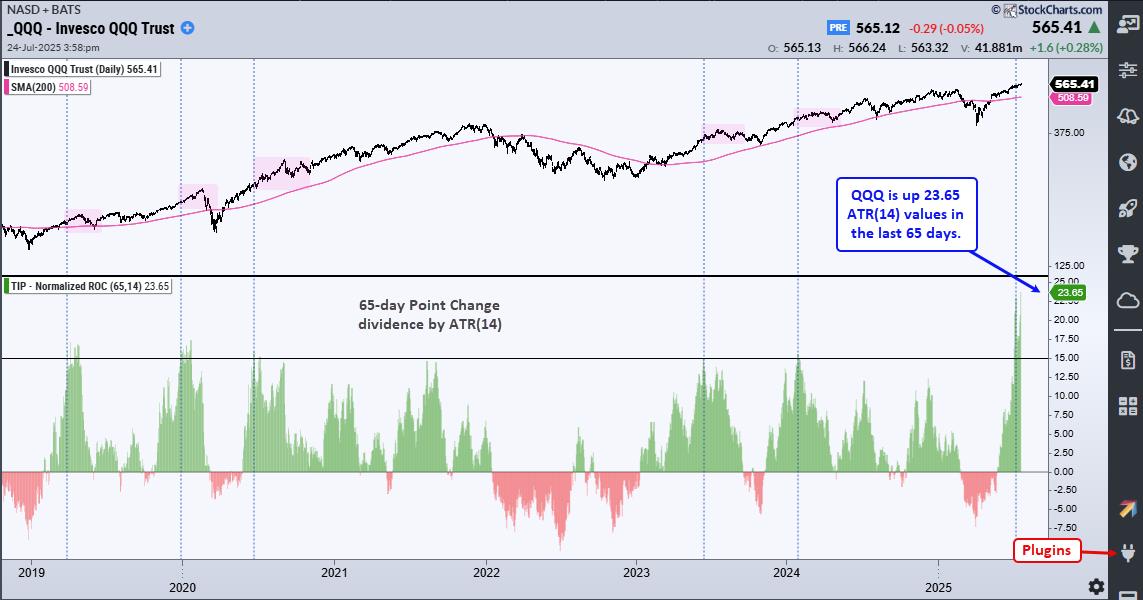
Chart Mania – 23 ATR Move in QQQ – Metals Lead 2025 – XLV Oversold – XLU Breakout – ITB Moment of Truth

S&P 500 Breaking Out Again: What This Means for Your Portfolio

Momentum Leaders Are Rotating — Here’s How to Find Them

Is META Breaking Out or Breaking Down?

A Wild Ride For the History Books: 2025 Mid-Year Recap

Driving the New Era of AI and IoT with Powercast’s One-Stop Shop for Wireless Power Solutions

Successful Launch of 11 Satellites – Geespace Completes Fourth Orbital Deployment of GEESATCOM

Rosenberger Telematics GmbH and Volkswagen Group Info Services AG enter into partnership for fleet data integration

Overlooking Total Cost of IoT Ownership Risks Millions in Hidden Costs, Eseye Report Warns

How Telematics Is Reshaping Transportation

I made memes for the White House. Here’s what I learned
Trump slams mail-in ballots as corrupt, but may not have the power to derail them
Russia launches largest attack on Ukraine this month following Trump’s meetings with Putin, Zelenskyy
Justice Barrett teases new memoir in abrupt conference exit
Gabbard removes clearances from 37 officials at Trump’s direction over politicizing intelligence
Here are some charts that reflect our areas of focus this week at TrendInvestorPro. SPY and QQQ are leading the market, but the tech...


The S&P 500 ($SPX) just logged its fifth straight trading box breakout, which means that, of the five trading ranges the index has experienced...

Is the market’s next surge already underway? Find out with Tom Bowley’s breakdown of where the money is flowing now and how you can...
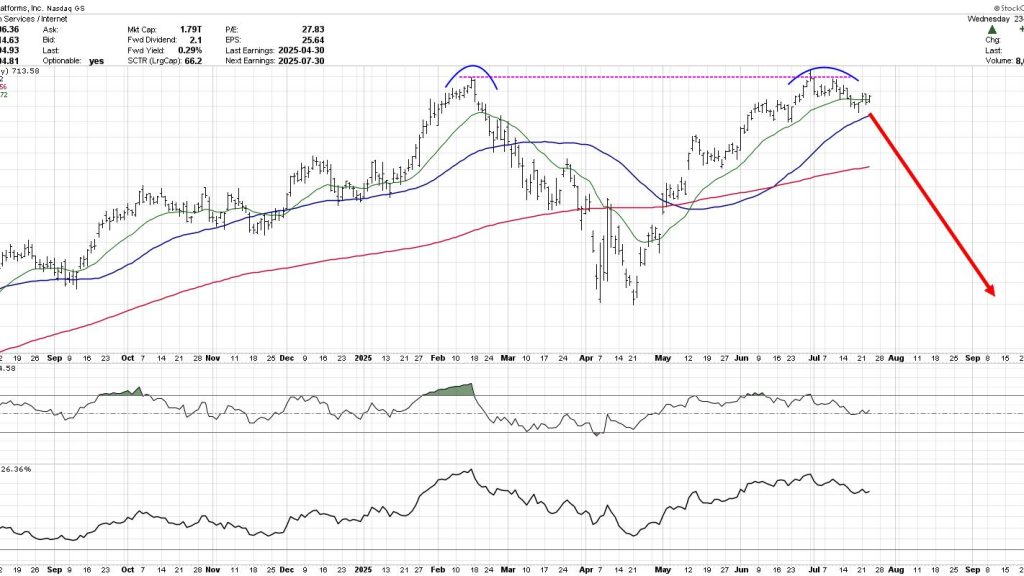
The chart of Meta Platforms, Inc. (META) has completed a roundtrip from the February high around $740 to the April low at $480 and...
Markets don’t usually hit record highs, risk falling into bearish territory, and spring back to new highs within six months. But that’s what happened...


On this edition of StockCharts TV‘s The Final Bar, Julius de Kempenaer of RRG Research points out that growth vs. value is now more...

On this week’s edition of StockCharts TV‘s Halftime, Pete covers the major indexes and reviews the bullish percents of the S&P 500 and Nasdaq...

Note to the reader: Over the next couple of weeks and months, I will be republishing the contents of my book, “Investing with the...


On this week’s edition of Stock Talk with Joe Rabil, Joe explains how to use multiple timeframes to help when getting an aggressive entry...
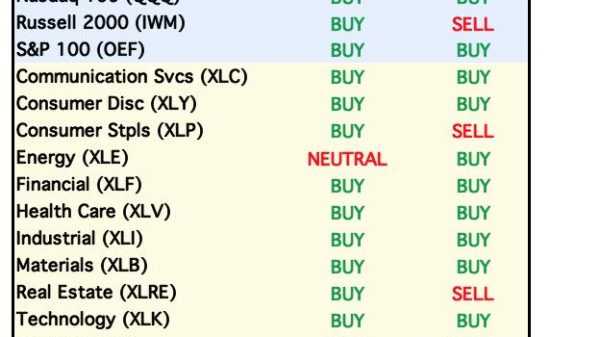
We publish this table daily to give an overview of the market, sector, and industry group indexes we follow. The Intermediate-Term Trend Model (ITTM)...


Happy Fed Day on this edition of StockCharts TV‘s The Final Bar. There was quite a bit of movement leading into the FOMC announcement,...

In this edition of StockCharts TV‘s The Final Bar, guest Joe Rabil of Rabil Stock Research shares his biggest takeaway from investing in 2023...


Note to the reader: Over the next couple of weeks and months, I will be republishing the contents of my book, “Investing with the...


For the 200th episode of StockCharts TV’s Sector Spotlight, I invite Wall Street legend Sam Stovall for an entertaining discussion. Before that, I starts...
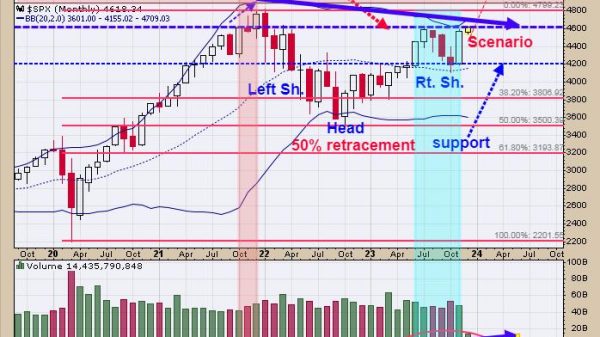
SPX Monitoring Purposes: Sold 11/29/23 at 4550.58 = gain 10.52%; long SPX 10/27/23 at 4117.37. Gain Since 12/20/22: 26.8%. Monitoring Purposes GOLD: Long GDX...