Hi, what are you looking for?
Stock
On this week’s edition of StockCharts TV‘s StockCharts in Focus, Grayson pulls back the curtain on our latest site-wide product release – one of...
Stock
There is no denying that Tesla has been a big-time outlier out of the Magnificent 7 stocks. While names like META have exploded to...
Stock
On this week’s edition of the GoNoGo Charts show from StockCharts TV, Alex takes a look at the market using the GoNoGo methodology as...
Stock
Before we get started today I wanted to encourage you to subscribe to our new YouTube Channel for DecisionPoint. We post the recording of...
Stock
What a week! Mega-cap tech stocks, the Fed meeting, and January’s nonfarm payrolls made headlines this week, creating an exhilarating week for investors. Friday’s...
Stock
The gold market saw a significant sell-off Friday morning, as unexpectedly strong job market data undermined investor hopes for imminent Federal Reserve rate cuts...
Stock
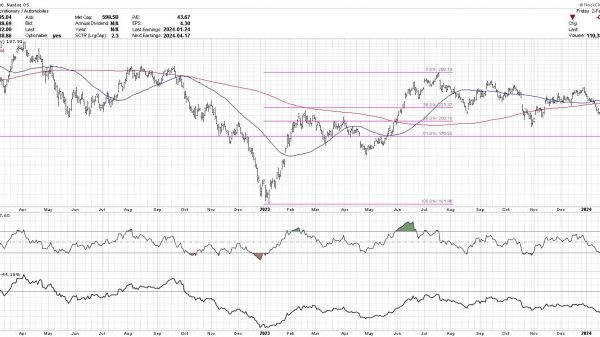
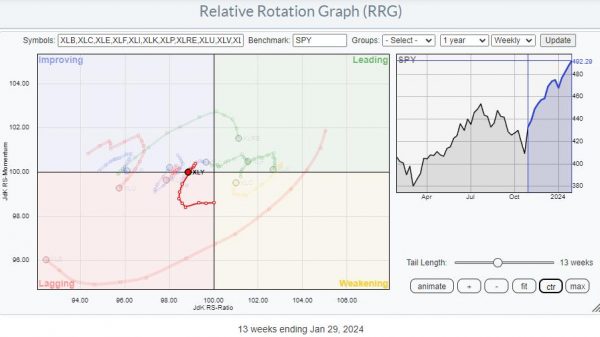
Cap weighted vs Equal Weighted. Sometimes, you need to look a little further. And concerning the rotations in Consumer Discretionary stocks, this is one...
Stock
In this edition of StockCharts TV‘s The Final Bar, Grayson and Dave run through charts they feel present actionable opportunities based on their technical...
Stock
In this edition of StockCharts TV‘s The Final Bar, Jay Woods, CMT of Freedom Capital Markets brings the energy of the NYSE floor to...
Stock
The tight supply environment in the housing market largely fueled DR Horton’s (DHI) strong year-and-a-half run. Last week, DHI’s earnings took a hit, missing...


