


The Zweig Breadth Thrust for the S&P 1500 triggered on Thursday as stocks surged last week. In poker terms, this thrust signals an abrupt participation shift as stocks move from folding to all-in within ten days. A bullish thrust signal is only part of the puzzle. How do we know when this signal fails? Today’s report will look at the ZBT signal in the S&P 1500 and offer an exit strategy. Stick around to the end for an offer to access a fully quantified strategy based on the Zweig Breadth Thrust.
******************************************
TrendInvestorPro subscribers have access to three timely reports. The first report/video explains the mechanics of the original NYSE-based Zweig Breadth Thrust indicator and then shows a modern version using S&P 1500 Advance-Decline Percent. Second, we also presented a trading strategy using ZBT signals for entry and another indicator for exits. The third report/video covers the setups and thrust signals for the percent above SMA indicators. Some of these indicators also triggered this week, but not all. Click here to take a trial and get full access.
*****************************************
ZBT Triggers for S&P 1500, but Not S&P 500
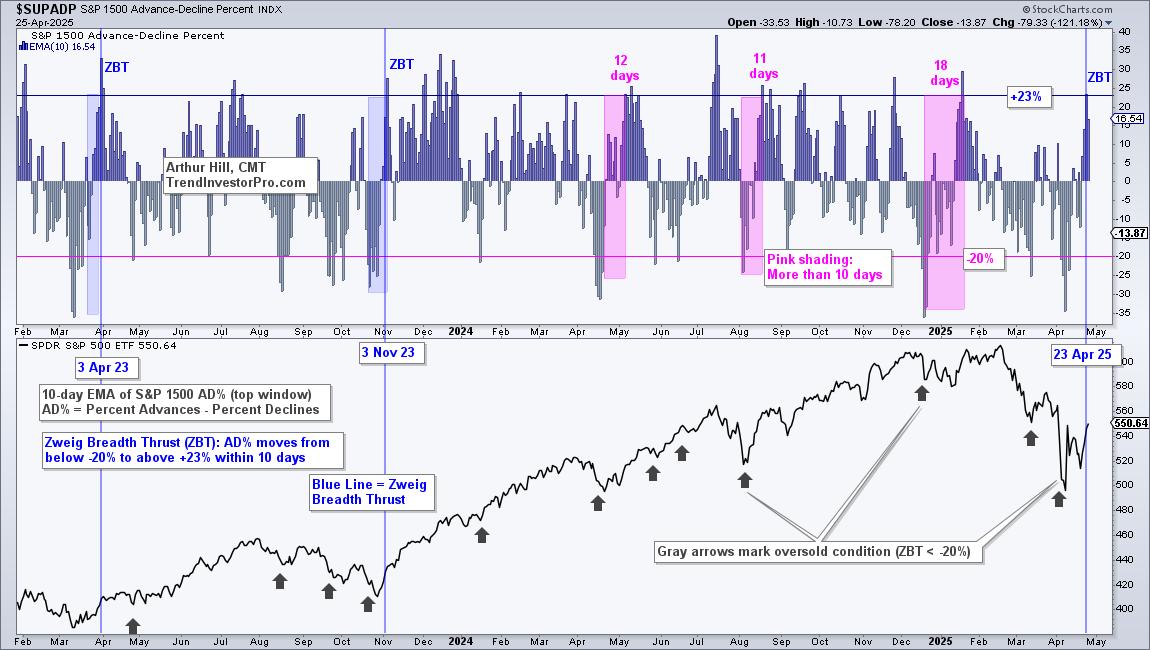
The first chart shows the Zweig Breadth Thrust (ZBT) indicator triggering bullish as it moved from below -20% to above +23% within ten trading days (blue line). This thrust signal means S&P 1500 advance-decline breadth became oversold with strong selling pressure and then recovered in dramatic fashion with a surge in upside participation. Moreover, this shift occurred within a 10 day window. This reversal of fortune was both sudden and sharp.
Note that the Zweig Breadth Thrust triggered an epic signal in November 2023, and we were on it. See this report (11-November-2023) for details on the original NYSE-based Zweig Breadth Thrust. See this report (18-November-2023) for details on using S&P 1500 Advance-Decline Percent to create a Zweig Breadth Thrust indicator.
S&P 500 ZBT Falls Short
The ZBT indicator for the S&P 500 did not trigger. The indicator was below -20% on April 8th and did not make it back above +23% within the 10 day window. In fact, the indicator did not make it back above +23% this week. This shows less upside participation within the S&P 500, and more upside participation within the S&P 1500. Small and mid cap breadth outperformed large-cap breadth this week.
Where’s the Exit?
The Zweig Breadth Thrust is only used for bullish signals, which means chartists must find another indicator to signal a failed thrust. As its name implies, a thrust is a strong upward move that is powerful enough to foreshadow an extended advance. The Zweig Breadth Thrust in November 2023 provides a classic example as SPY continued higher, never looking back. The blue line shows when both the S&P 1500 and S&P 500 ZBT indicators triggered in early November.
Chartists looking for an exit strategy can consider prior support levels based on reaction lows (troughs). The horizontal blue lines show these support levels, starting with the late October 2023 low. SPY forged a reaction low in January 2025, hit a new high in February and then broke support to trigger an exit. Current support levels are based on the April lows.
Chartists looking for a more dynamic approach can consider a trend-following indicator, which we will explore next (subscribers). This strategy is fully disclosed and quantified with backtest results. Click here to take a trial and get immediate access!
/////////////////////////////////////////


