


The S&P 500, NASDAQ 100, and Russell 2000 fell 10.5%, 13.8%, and 19.5%, respectively, from their recent all-time highs down to their March lows. Each index paused long enough and deep enough for a correction, with the Russell 2000 nearly reaching cyclical bear market territory (-20%).
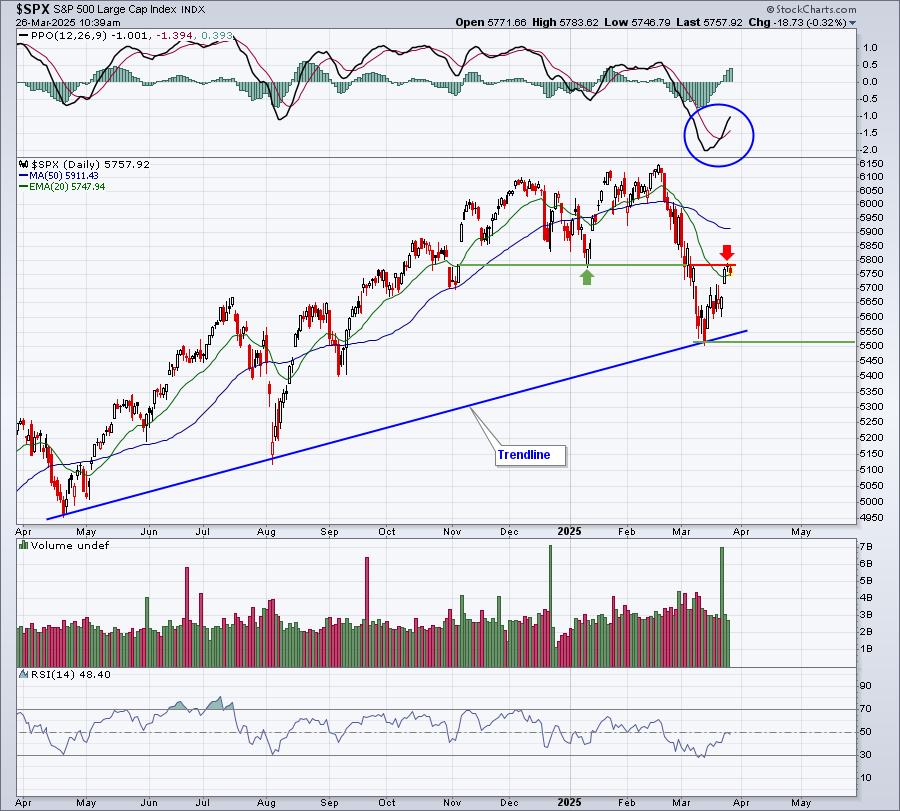
At this point, there’s key price resistance on the S&P 500. Moving through it doesn’t necessarily mean we’re “in the clear.” However, failure to move through and then rolling back over increases the odds of another test of recent low price support. Check out the range I’m watching on the S&P 500:
Key price resistance, in my view, is at 5782 on the S&P 500. That was the gap support from early November and also the price support from mid-January. Now we’re trying to break above that resistance, while at the same time trying to hang onto now-rising 20-day EMA support.
As for support, the April and August lows in 2024 intersect beautifully with the March 2025 low. That’s something to keep an eye on if we begin to head lower again. The price support on the S&P 500 is now just above 5500, so a close beneath that level would be damaging – at least in the very near-term. I say that, because any new closing low would be accompanied by a higher PPO, a positive divergence. Many times, a reversing candle and a positive divergence will mark a significant bottom. So there’ll be plenty to watch over the next few days to few weeks.
I also want to show you how the S&P 500 is performing on a short-term chart vs. the NASDAQ 100, which is the more aggressive index:
It’s just a little thing, but the S&P 500 and NASDAQ 100 had been trading mostly in unison over the past week or two, but with this morning’s weakness, note that the NASDAQ 100 has moved back down to Monday’s opening gap higher, while the S&P 500 still remains well above it. Here’s one reason for it:
Since the Fed announcement one week ago, discretionary stocks (XLY) had reversed its downtrend vs. staples stocks (XLP). But check out today’s action! Maybe this is just short-term and we’ll see a reversal later, but it’s hard to be overly encouraged when staples goes up 1.14%, while discretionary drops 0.64%.
It’s a warning sign.
I know there are TONS of mixed signals out there and everyone wants to know whether this recovery is the REAL DEAL or if it was only temporary before the next shoe drops. Well, if you’re interested, I’ll be hosting a FREE event on Saturday.
Correction or Bear Market?
That’s the topic of our Saturday event, which will begin promptly at 10am ET. I will be providing multiple angles/charts/strategies and what each of them are telling us. If you’d like to join me on Saturday and would like more information, REGISTER NOW.
Even if you have a prior commitment on Saturday, we plan to record the event and send out the recording to all who register. So act now to attend and/or receive your copy of the recording.
Happy trading!
Tom


