Overall Analysis
After breaking its upside channel pattern, the EUR/USD pair fell sharply without any halt. EUR/GBP failed to sustain at higher levels. Price fell sharply and is currently near day resistance.EUR/USD Chart Analysis
EUR/USD 15-Minute Chart (Source: TradingView)
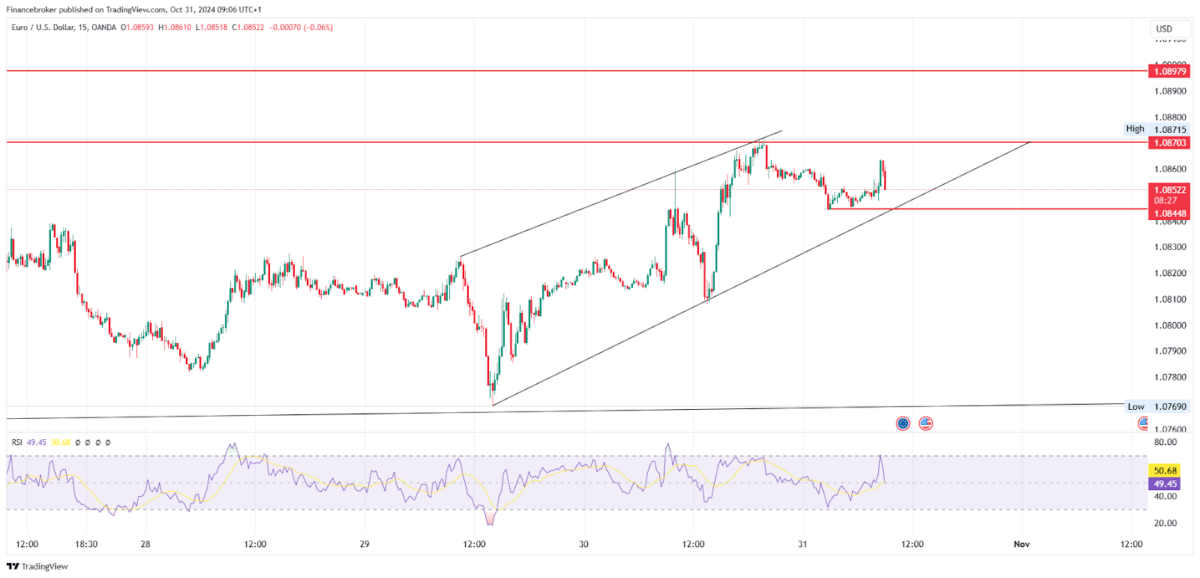
On the 5th Nov 2024 trading session, EUR/USD pair showed an upside rally till the resistance trendline. Pairs were moving in an upside channel since 29th Oct, and finally gave a breakdown on 6th Nov.
On a daily time frame, prices can be seen breaking down shapely by falling nearly 2%. Earlier on 23rd Oct price completed its double top pattern target. Later it took support from the 1.07781 level and failed to break it. Pairs have broken the 1.07781 level, but daily candle closing is necessary before making sell side entry.
Pairs on 15 15-minute time frame are currently taking a halt after a sharp fall. Based on current price action, a double bottom pattern has been formed which can trigger reversal if not sustained.
If looking for an entry trigger, then one can plan under two conditions.
If the price breaks the 1.07946 level, which is the double bottom’s neckline and situations above it, then buy-side entry can be planned with stop loss below the previous swing and target till 1.08509 followed by trailing. If the price breakdown is 1.07133 level and sustains below it with an RSI below 65, then entry can be made with stop loss above the previous swing high and target till 1.0665.EUR/GBP Chart Analysis
EUR/GBP 15-minute Chart (Source: TradingView)
On the 5th Nov 2024 trading session, Pairs showed strong sideways momentum, with price making a swing in the last hour of the session. Sharp selling was triggered at the beginning of the 6th Nov trading session.
On a daily timeframe, the pair is currently moving in a box-shaped pattern taking resistance from 0.84470 level and support from 0.83110. Pairs are in continuous selling. This zone acts as a distribution zone. Breaking this zone can lead to a trendy market.
Currently, on a 15 min time frame, after a sharp fall since opening price is taking a halt between 0.83494 and 0.83301.
If you are looking for an entry trigger, then there are a few mentioned below.
If the price breaks the 0.83301 level and sustains below it, then sell-side entry can be made with a stop loss above the previous swing and target till 0.83110. If the price breaks and sustains above 0.83494 and sustains above it, then buy-side entry can be made with a stop loss below the previous swing low and target of 0.83624 level.The post EUR/USD & EUR/GBP Analysis: Sharp Decline as Key Levels Fail appeared first on FinanceBrokerage.


