


New possibilities emerge with the release of the new “Panels” on the StockCharts dashboard.
Market Factors Panel
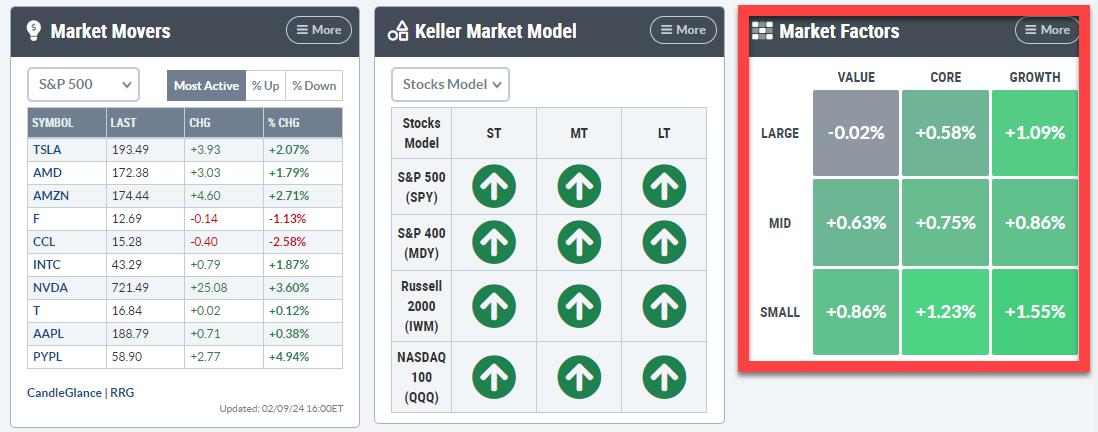
One of them is the “Market Factors” panel
This panel slices the S&P 1500 into nine segments broken down by size-value-growth.
It is very similar to the one used in the RRG dropdown.
The only difference, and there is quite a distinct difference, as you will see, is that this panel uses S&P indices and only covers the S&P 1500 segments. So the S&P 400,500 and 600 and its growth and value brothers and sisters.
Two RRGs
Here is the RRG from the pre-defined list.
As you can see, I have ticked off the US Growth and US Value indexes as they cover the entire market (all size segments) and the DJ US index, the benchmark on this graph.
This is the RRG for the market factors using the same underlying ETFs as the Market Factors panel.
The RRG is linked (just click the image) to a live version on the site, which you can then save as a bookmark in your browser for later retrieval. I will also add this to the group of pre-defined universes.
The benchmark for this group is the S&P Composite 1500 index ($SPSUPX).
Same Approach But Different Images
Looking at these two RRGs, you can see that they are quite different from each other but, in the bigger picture, send a similar message.
The differences are primarily caused by the different universes. The DJ groups hold 153 stocks in the large-cap index, 314 in the mid-cap index, and 610 in the small-cap index. So, especially in the large and mid-cap segments, the S&P groups are much broader, which can have big effects on the behavior of the indexes.
I use these “Big Picture RRGs” from a very high level. This means I pay much more attention to the general rotations of the various tails vis-a-vis each other than to their exact locations on the RRG.
One observation that I found quite interesting on the “Market Factors Panel” RRG is the location of the cluster SPYG, SPY, and SPYV.
What you can learn from this cluster of tails is their positioning on the RRG and the relative positioning among the three of them.
First of all, these are all S&P 500, so large-cap indices, and they are positioned to the right of the benchmark (S&P 1500) and thus in a relative uptrend. You can also see that inside the S&P 500 segment, growth is rapidly improving against value. The preference started to turn around some 5 weeks ago when the growth and value tails started to curl.
What you also see, just like on the DJ version, only in a different location on the RRG, is that the mid-and small-cap groups for both the growth and value segments have started to roll over, some of them already at a negative heading.
The only group still at a positive heading is Large Cap Growth, and maybe Midcap growth, albeit debatable as this tail is still inside the improving quadrant but on flat momentum at the lowest RS-Ratio reading in the universe.
This is something to ponder over the weekend as it means that, once again, the foundation of the rally is getting narrower after an attempt of the mid-and small-cap groups to start participating. This attempt seems to fail while the market continues to climb….. a “Wall of Worry?” Only time will tell but I believe there is reason enough to get more cautious, and risk is increasing every day.#StayAlert and have a great weekend. –Julius


