


High-yield bonds tend to trade more like the stock market than like treasury bonds, and what’s more is that these high yield or “junk” bonds are terribly sensitive to liquidity conditions. That sensitivity works both ways. When money is so plentiful that even the most marginal quality investments can get some, that is a sign that liquidity is going to be plentiful for a while for all types of stocks. And when liquidity starts to dry up, these high-yield bonds tend to be the first victims.
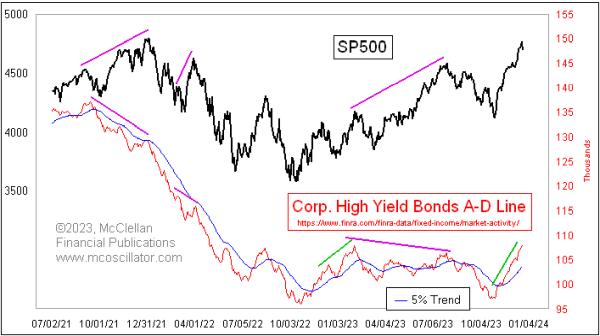
Back in 2021, I highlighted the big bearish divergence evident between the higher price highs in the S&P 500 and the lower tops in the High Yield Bond A-D Line. That was a correct omen of the liquidity troubles to come in 2022. Things started looking better coming out of the October 2022 bottom, when we saw strength in this HY Bond A-D Line, but that strength eventually gave way to another bearish divergence versus the S&P 500 in the summer of 2023.
Now we are once again seeing great strength in this A-D Line, as it is going up at a very steep angle, and matching the price gains of the S&P 500 step for step. The message is that liquidity is plentiful, and should remain so for a while. There is no sign of a divergence yet, and I would expect that we shall see a divergence with prices before any real trouble gets started. That has been the track record for these data, which FINRA publishes going back as far as 2005.
One note about these data: You can access them daily at this link. FINRA does not post the data until very late at night for the preceding trading day, because evidently it takes a while to compile all of those statistics. FINRA also rejiggered that web site, changing the format so that it is easier for those who are adept at programming to be able to scrape the data automatically. It takes a while to learn to read through the multiple lines of data, but what you want is to fetch the “CORP” data series if you wish to replicate this chart yourself. Or you can sign up at our web site for our twice monthly McClellan Market Report or our Daily Edition, where we feature it periodically.


