Since we came back from vacation, I’ve written 3 Dailys. The first of these was on the Economic Modern Family and how it opened its loving arms to the bulls.
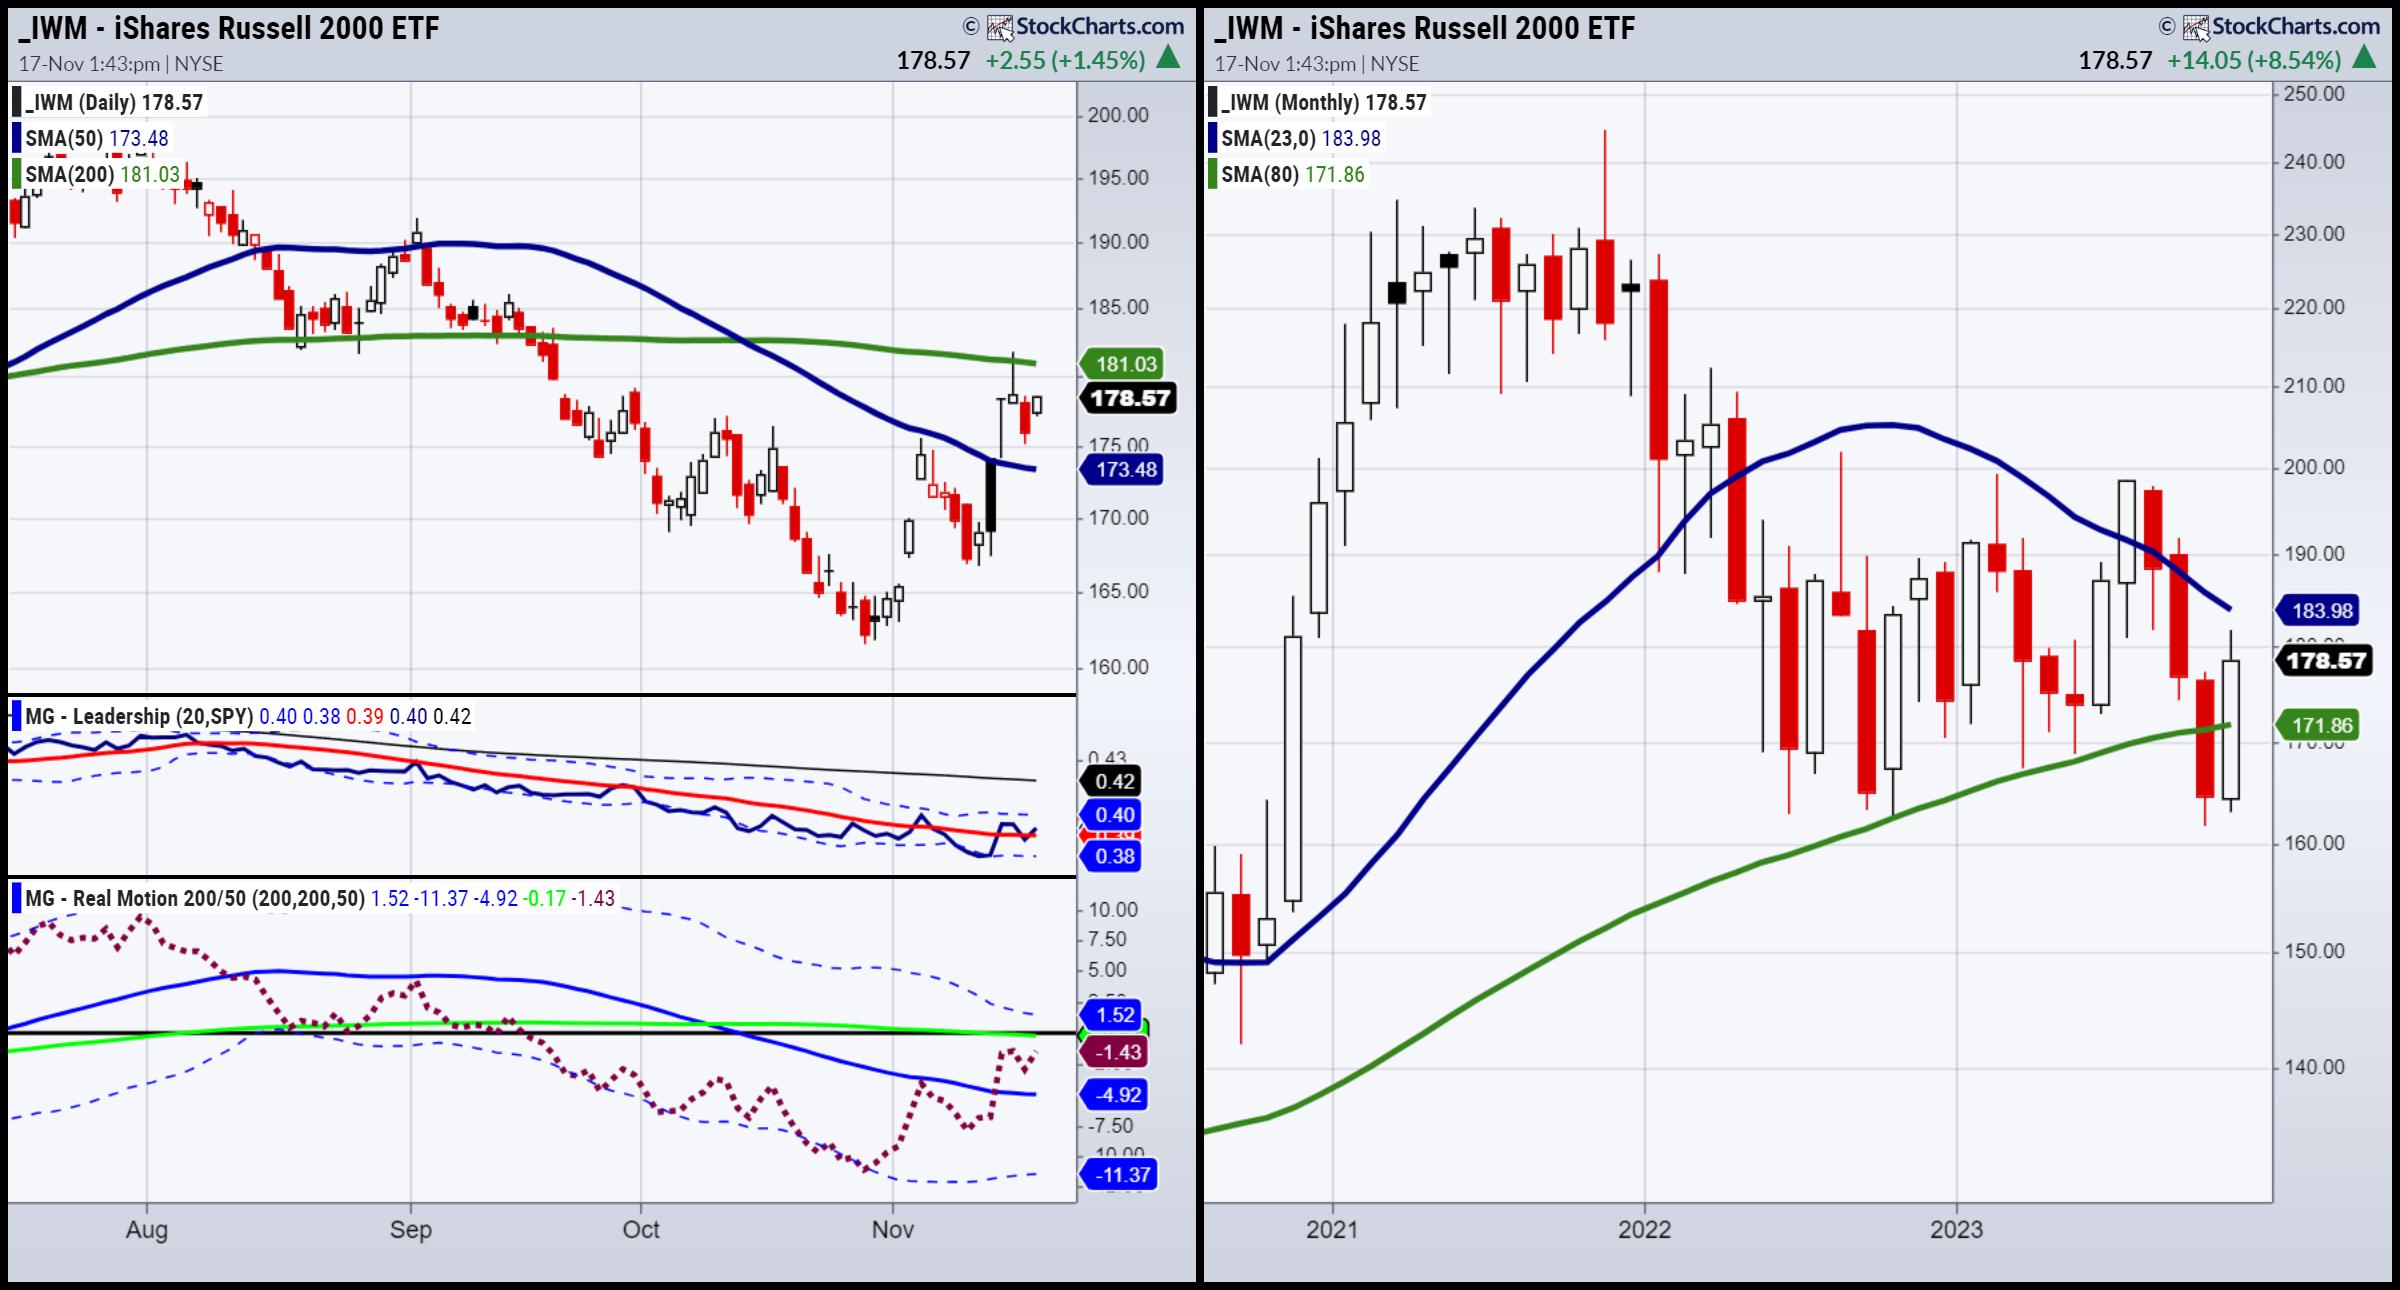
I was particularly keen on small caps or the Russell 2000 (IWM). I wrote, “Beginning with Granddad Russell 2000 (IWM), Monday began with a gap up over the 50-DMA (blue). We will watch for a phase change confirmation. Furthermore, the monthly chart shows IWM back above the 80-month MA (green). Resistance at 191 area is on tap if IWM holds above 174.”
Phase change? YES. Holding 174? YES. Still above the 80-month MA? YES. 191 on tap if continues to hold? YES.Next, I wrote a Daily about Soybeans as the next potential parabolic runner.
“Meanwhile, the Teucrium Soybean Fund SOYB saw a huge influx of investor money. The monthly chart featured shows prices hovering around all-time highs. In 2012 the high was 28.88. In July this year, SOYB made a new high at 29.43. The sideways consolidation on this monthly chart suggests a move to 34-35 is possible.”
The daily chart is in a bullish phase? YES.The futures contract here, shown through the continuous contract and not the January 2024 contract, looks different. The continuous contract is under the 23-month MA, while the futures contract of the ETF sits above the 23-month.
Sideways consolidation? YES. Ready to run? NOT YET. (But watch for a move over 1400 in January 2024 contract as a good start provided this holds 1250.)The next Daily this week was titled Oil the New Gold — Buy When There’s Blood in the Streets. The thesis was that oil is a buy just as everyone got bearish. Just like gold, “you buy it when it looks awful, and sell it when it looks strong.”
The futures contract (December) shows you that $72 held Friday, with a move to nearly $76.
Was it a buy with blood in the streets? YES. Do we have a support level now? YES.If you have a listen of my 2 latest videos in the media section below, you will hear that I boldly called a bottom and describe what levels must clear from here.
This coming week, watch for oil to get over $76 to continue the rally.
This is for educational purposes only. Trading comes with risk.
If you find it difficult to execute the MarketGauge strategies or would like to explore how we can do it for you, please email Ben Scheibe at Benny@MGAMLLC.com, our Head of Institutional Sales. Cell: 612-518-2482.
For more detailed trading information about our blended models, tools and trader education courses, contact Rob Quinn, our Chief Strategy Consultant, to learn more.
Traders World Fintech Awards
Get your copy of Plant Your Money Tree: A Guide to Growing Your Wealth.
Grow your wealth today and plant your money tree!
“I grew my money tree and so can you!” – Mish Schneider
Follow Mish on Twitter @marketminute for stock picks and more. Follow Mish on Instagram (mishschneider) for daily morning videos. To see updated media clips, click here.
Mish in the Media
In this appearance on BNN Bloomberg, Mish covers the emotional state of oil and gold, plus talks why small caps are the key right now. She also presents a couple of picks!
Learn how to trade commodities better with Mish in this interview with CNBC Asia!
Mish and Charles Payne discuss why the small caps, now in mid range still have a chance to rally in this appearance on Fox Business’ Making Money with Charles Payne.
Mish talks about Tencent Music Entertainment on Business First AM.
Mish talks bonds with Charles Payne in this clip from October 27, recorded live in-studio at Fox Business.
Live in-studio at Yahoo! Finance on October 26, Mish does a chart deep dive with Jared Blikre.
Mish talks 401(k)s at the NYSE in this October 26 video from Cheddar TV.
Mish covers the bond rally and how consumers could save the day in this October 24 video from Business First AM.
Coming Up:
November 20: Yahoo! Finance & Real Vision
November 28: Your Daily Five, StockCharts TV
November 30: Live Coaching
December 3-December 13: Money Show Webinar-at-Sea
Weekly: Business First AM, CMC Markets
ETF Summary
S&P 500 (SPY): 450 clears see 465. Under 450, 435 support. Russell 2000 (IWM): 181 resistance, 174 support. Dow (DIA): 360 resistance, 346 support. Nasdaq (QQQ): 388 must clear and 370 must hold. Regional Banks (KRE): 45 big resistance. Semiconductors (SMH): 160-161 pivotal support. Transportation (IYT): 235 support. Biotechnology (IBB): 120 pivotal. Retail (XRT): 65 resistance and 60 pivotal support.Mish Schneider
MarketGauge.com
Director of Trading Research and Education


