


Below is a reprint of an article written Thursday in the subscriber-only DecisionPoint Alert:
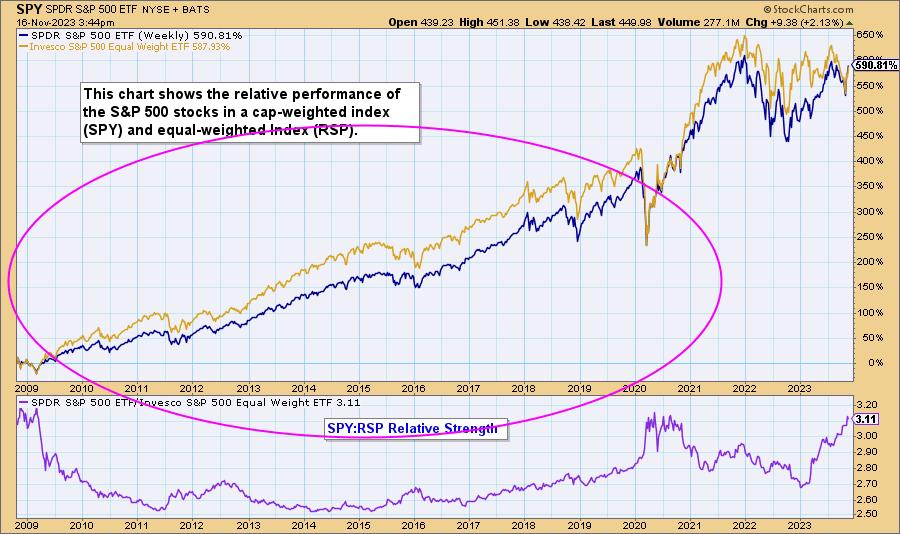
One of the things we keep track of is the performance of the S&P 500 Index (SPY), which is cap-weighted, versus the S&P 500 Equal Weight Index (RSP). In a healthy bull market the equal weighted index (tan line) will out perform the cap-weighted index (blue line) because the advance is broadly based. This is demonstrated by the chart below.
As an advance gets closer to a top, participation narrows and the cap-weighted index takes the lead. We are now at that point in the rally, as you can see from the next chart — the leadership shifted months ago. That doesn’t mean that the rally has to end right away, but it will probably end sooner than later.
Good Luck & Good Trading,
Carl Swenlin & Erin Swenlin
Black Friday – Cyber Monday Sale is Coming for New Subscribers!
We will be running our best special yet next weekend! Be sure to sign up for our free email list from our homepage to ensure you get all the details! We also send out free articles and free educational material periodically. We will not blow up your inbox!
Learn more about DecisionPoint.com:
Watch the latest episode of DecisionPoint on StockCharts TV’s YouTube channel here!
Try us out for two weeks with a trial subscription!
Use coupon code: DPTRIAL2 at checkout!
Technical Analysis is a windsock, not a crystal ball. –Carl Swenlin(c) Copyright 2023 DecisionPoint.com
Disclaimer: This blog is for educational purposes only and should not be construed as financial advice. The ideas and strategies should never be used without first assessing your own personal and financial situation, or without consulting a financial professional. Any opinions expressed herein are solely those of the author, and do not in any way represent the views or opinions of any other person or entity.
DecisionPoint is not a registered investment advisor. Investment and trading decisions are solely your responsibility. DecisionPoint newsletters, blogs or website materials should NOT be interpreted as a recommendation or solicitation to buy or sell any security or to take any specific action.
Helpful DecisionPoint Links:
DecisionPoint Alert Chart List
DecisionPoint Golden Cross/Silver Cross Index Chart List
DecisionPoint Sector Chart List
DecisionPoint Chart Gallery
Trend Models
Price Momentum Oscillator (PMO)
On Balance Volume
Swenlin Trading Oscillators (STO-B and STO-V)
ITBM and ITVM
SCTR Ranking
Bear Market Rules


