


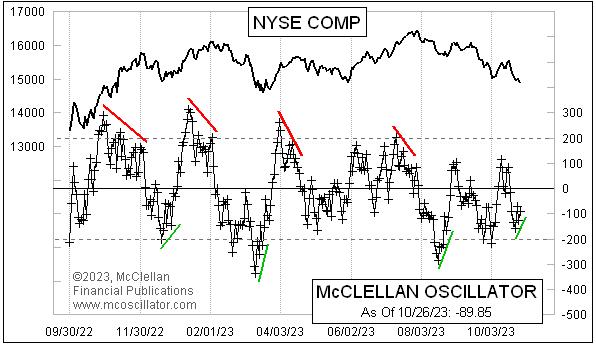
Two weeks ago, I wrote here about the McClellan Oscillator leaving a “simple” structure above zero, which said that the bulls were not (yet) in charge. The major averages since then have pushed to a lower low, even as seasonality says that the uptrend is supposed to be starting again now. But as prices have made lower lows, the NYSE’s McClellan A-D Oscillator is making a bullish divergence, which says that the energy is going out of the decline.
The McClellan Oscillator can be thought of as an accelerometer for the A-D Line. In mathematical terms, it could be said to be like the second derivative of the A-D Line, and its companion tool the McClellan Summation Index is like a first derivative. So when the Oscillator is negative, it says that the trend is down, and when it is really negative, it says that the trend has been accelerating downward at a rapid pace.
When the Oscillator makes a divergent higher low, by which I mean a less negative one, it says that the once steep downward acceleration is moderating, which can be a prelude to an upturn. It is easier for the bulls to take over once the bears start getting tired.
One problem with a divergence, either a bullish or a bearish one, is that it is only a “condition” and not a “signal”. Nothing says when such a condition has to matter, although old technical analysts will tell you that a condition will finally matter right after the moment when you give up expecting it to matter.
Stock prices do not have to start turning upward just because of a bullish divergence in the McClellan Oscillator. But it sure helps. We can even see a bullish divergence in a McClellan Oscillator calculated on the A-D data for the stocks in the Nasdaq 100 Index:
Not only is it a “local” divergence, with the latest reading being just slightly higher than that of 4 days prior, but it is also a divergence in a larger sense, as each of the successive down waves since the July 2023 price top has seen waning downward energy. The divergent higher low in late September 2023 did not matter enough to halt the overall decline, and there is no mandate that this now second higher Oscillator low has to lead to a price advance. But it does constitute more evidence in support of one. And historically, a double divergence like this, with a third bottom higher than the prior two, hints at a stronger move to come.


