


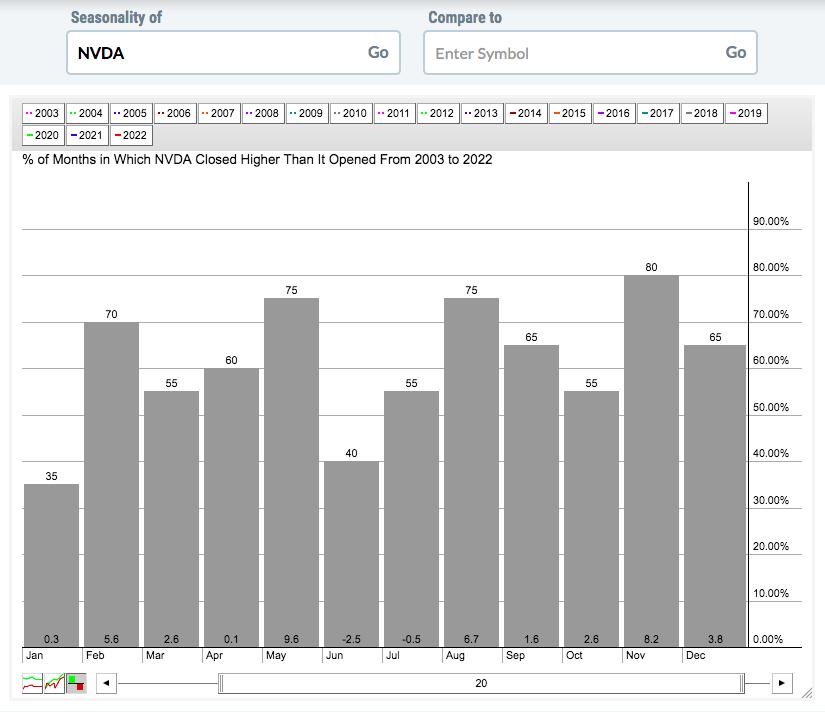
Over the past six trading days, NVDA has fallen from a high of 476.09 to Friday’s low of 410.78. That’s a drop of 65.31, or nearly 14%, in just over one week. Would it make sense to take advantage of this selling? Well, like any other stock, NVDA is subject to overall market headwinds or tailwinds. Currently, there are plenty of headwinds and there are also reasons to believe these headwinds will persist in the very near-term. I discussed the current environment in an article I published earlier today, “Odds Favor Further Selling This Week (Maybe a LOT of it)”. Be sure to check it out. Part of trading and/or investing success boils down to preparation. For those interested in NVDA, check out its 20-year seasonality chart from 2003 to 2022:
Do you notice that the probability of monthly gains spikes in the second month of each calendar quarter – February, May, August, and November? Those are the four most likely calendar months that we’ll see gains in NVDA. And how about those average monthly returns? To summarize, here’s how the average returns break down by calendar quarter months:
1st month of calendar quarter (Jan, Apr, Jul, Oct): +2.5% 2nd month of calendar quarter (Feb, May, Aug, Nov): +30.1% 3rd month of calendar quarter (Mar, Jun, Sep, Dec): +5.5%NVDA has been a tremendous performer, actually one of the best-performing stocks of this century. But did you know that the second calendar month of each calendar quarter is responsible for most of those gains? There’s one reason for this bullish timing on NVDA – earnings! NVDA typically reports earnings in February, May, August, and November. And earnings drive prices. There’s a TON of NVDA accumulation (by big Wall Street firms) heading into earnings each quarter. That’s why we see those crazy returns when we compare the 1st, 2nd, and 3rd months of calendar quarters. Knowing this type of information can be a real game changer for traders, wouldn’t you agree? Don’t you feel like your odds of winning trades on NVDA just improved?
I’m a stock market history buff. If you want to learn more about the stock market and how it operates, you MUST understand history and historical tendencies. It’s what I discuss in my FREE pdf report, “Money Flows”. Use THIS LINK to download your copy NOW – and for FREE!
Happy trading!
Tom


