


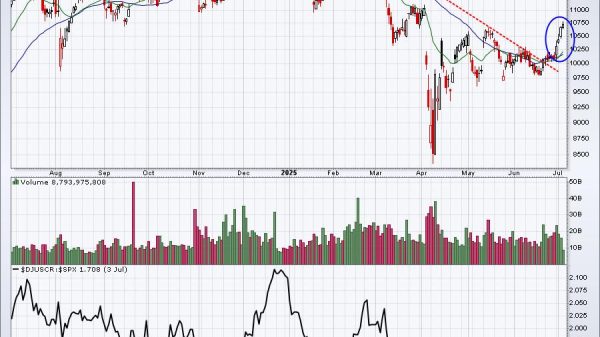


The Russell 2000 ETF (IWM) closed below the 200-day SMA for the first time since, well, June 1st. The last cross was not that long ago and recent crosses simply resulted in whipsaws. Truth be told, 200-day SMA crosses are not that relevant for IWM.
Testing 200-day SMA Crosses for IWM (and SPY)
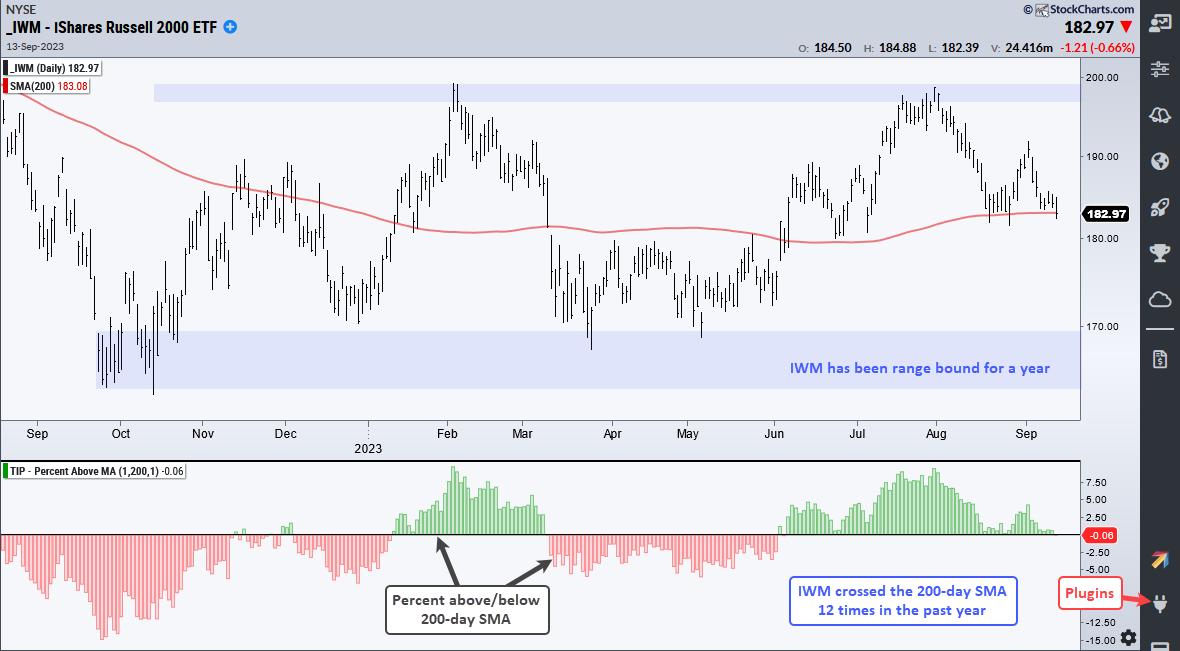
The chart below shows IWM in the top window and the Percent above MA (1,200,1) indicator in the lower window. This indicator turns green when IWM closes above its 200-day and red when IWM closes below. There were fourteen crosses in the past year alone. Note that this indicator is part of the TIP Indicator Edge Plugin for StockCharts ACP.
IWM 200-day SMA
A dozen crosses and nothing to show makes sense because IWM is stuck in a trading range. Moving averages are trend-following indicators that perform poorly when price moves sideways. The chart above shows IWM trading between 162 and 200 since last September (blue shading). Moving average signals are resulting in whipsaws.
One year is not long enough to decide the efficacy of a moving average cross. As such, I tested the 200-day cross in IWM over the last 20 years. The first test is a long and short test. This means buying/covering on a cross above the 200-day SMA and selling/shorting on a cross below the 200-day SMA. As the top line shows, such a strategy did not work because the Compound Annual Return was -3.02%.
The second line shows a long only strategy and the 200-day cross managed to make some money. Not much though. The Compound Annual Return was a meager 2.09%. This meager return came with a high cost because the Maximum Drawdown was a whopping 38.2%. For comparison, SPY generated at 5.68% Compound Annual Return with a 21.98% Maximum Drawdown. There is some value in SPY signals. As such, I would ignore the 200-day SMA crosses in IWM and pay attention to signals in SPY.
Check out the Chart Trader report at TrendInvestorPro to learn more on current market conditions. Thursday’s report covered:
risk-on/risk-off dynamics in the market lack of participation in two breadth indicators a key test for the 20+ Yr Treasury Bond ETF a key tech ETF breaks and another teeters three defensive stocks with bullish breakoutsClick here to learn more and gain immediate access.
—————————————


