


SPX Monitoring Purposes: Long SPX 6/21/23 at 4365.69; sold 7/21/23 4536.34=gain 3.91%.
Long SPX on 2/6/23 at 4110.98: Sold 6/16/23 at 4409.59 = gain of 7.26%. Gain since 12/20/22=17.68%.
Monitoring Purposes GOLD: Long GDX on 10/9/20 at 40.78.
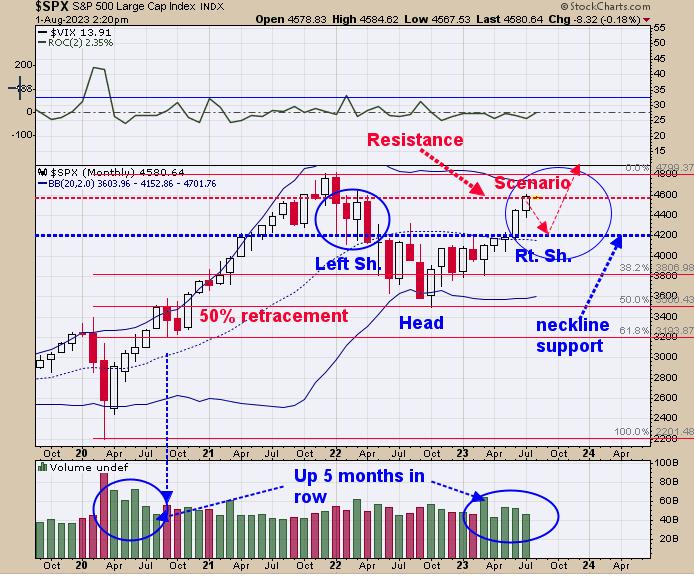
Our view remains the same; we said yesterday, “The middle window is the monthly SPX. The SPX is running into the highs of February, March, and April 2022 near the 4600 range, which is a natural resistance area and may stall the market. Seasonality-wise the market is entering into the weakest quarter of the year starting now and turning to October. Our view is that a trading range may develop with a resistance near 4600 SPX and support area near 4200. This potential trading range could last into October and develop a ‘Right Shoulder’ of a head-and-shoulders bottom, where the ‘Left Shoulder’ developed from February to April 2022. The ‘Head’ of this potential head-and -shoulders bottom lies at the October 2022 low. SPX was up five months in a row and August is one of the weakest months of the year and that combination could lead to a pull back. VIX remains relative low and still leans bullish. Don’t see a good setup yet.”
The second window down from the top is the SPX/TLT ratio. Markets always try to keep in balance and, when out of balance, it will go back to the norm. When the RSI for the SPX/TLT ratio trades above 70 (current reading is 82.10) the SPX was near a short-term high. We circled in red on the SPX chart when the RSI of the SPX/TLT ratio was above 70. With a current RSI reading of 82.10 on the SPX/TLT ratio, the upside for SPX would seem limited. We have said that there is a possibility that the Bearish Engulfing pattern high of July 27 (4607.07) may be tested before a pullback begins, and that possibility is still present.
Tim Ord,
Editor
www.ord-oracle.com. Book release “The Secret Science of Price and Volume” by Timothy Ord, buy at www.Amazon.com.
Signals are provided as general information only and are not investment recommendations. You are responsible for your own investment decisions. Past performance does not guarantee future performance. Opinions are based on historical research and data believed reliable; there is no guarantee results will be profitable. Not responsible for errors or omissions. I may invest in the vehicles mentioned above.


