


Sector Rotation Stalls, Tech Remains King
Despite a slight rise in the S&P 500 over the past week, the sector rotation landscape is presenting an intriguing picture. For the first time in recent memory, we’re seeing absolutely no changes in the composition of the sector ranking — not just in the top five, but across the board. Will this stability kick off a return to a period of more significant trends in relative strength and a return to outperformance for the portfolio?
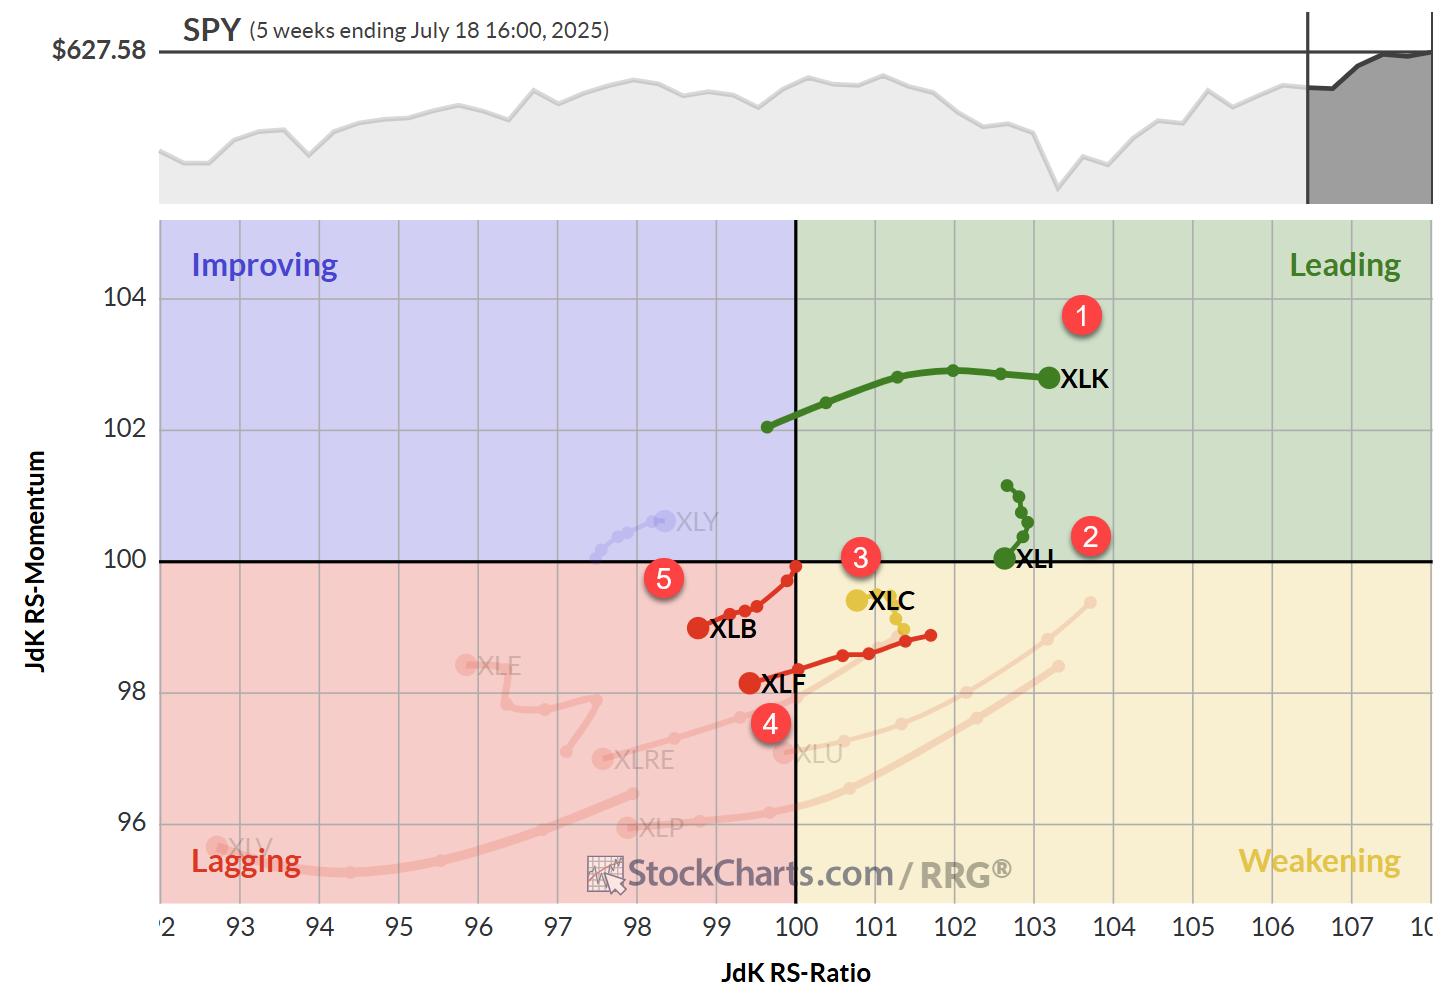
(1) Technology – (XLK)(2) Industrials – (XLI)(3) Communication Services – (XLC)(4) Financials – (XLF)(5) Materials – (XLB)(6) Utilities – (XLU)(7) Consumer Discretionary – (XLY)(8) Consumer Staples – (XLP)(9) Real-Estate – (XLRE)(10) Energy – (XLE)(11) Healthcare – (XLV)Technology
The tech sector continues to flex its muscles, moving up on the price ratio scale while maintaining a stable momentum around 103. This sustained strength is a clear indication that tech remains the sector to beat in the current market environment.
On the daily RRG, we’re seeing a nice rotation backup for tech while inside the weakening quadrant, a sign of strength that confirms the move on the weekly RRG. The raw RS line for tech is climbing almost straight up, reflecting very strong RRG lines. There might be a slight loss of momentum, but make no mistake, tech is still the strongest player in the game.
Industrials
Industrials is currently rotating out of the leading quadrant and sits on the verge of moving into weakening. However, it’s crucial to note that it still holds the second-highest rank based on the RS ratio. This positioning suggests that the odds for a rotation back up towards the leading quadrant are still in play.
The daily RRG shows industrials confirming its strength with a move further into the leading quadrant, moving up on the RS ratio scale while keeping stable momentum.
After breaking out of overhead resistance, the price chart continues higher, and a new higher low is visible on the relative strength line. This keeps the RS ratio line at elevated levels, though the RS momentum line is still moving lower just above 100. If this RS line can maintain a series of higher highs or higher lows, I expect the RS momentum line to bottom out soon and follow the RS ratio higher.
Communication Services
The communication services sector is positioned inside the weakening quadrant on the weekly RRG but has hooked back to the left and is now even lower on the RS ratio scale. It’s moving towards the lagging corner, which is a concerning trend for its top 5 position.
On the daily RRG, communication services have moved into the lagging quadrant. It has started to slow down on the negative momentum, but we need a rotation back up on this daily RRG into the improving quadrant and back to leading to have that weekly tail curl back up to its leading quadrant as well.
The price chart shows the sector holding up after breaking higher, with a pullback now finding support at the level of old resistance, respecting the rule that old resistance is expected to work as support going forward. The problem child here is the raw RS line, which has fallen below its rising support line. This is taking its toll on the RRG lines, with both RS ratio and RS momentum rolling over and starting to move down.
Financials
Financials are inside the lagging quadrant on the weekly RRG, moving at a negative heading. This means that a significant amount of strength is needed from the daily tail to keep this sector within the top five.
On the price chart, financials are playing around with overhead resistance around 52, with a small consolidation area and a pennant-like formation suggesting more upside potential on the price chart.
However, this is not confirmed on the relative strength chart, where the RS line has broken its rising trend and is moving lower.
Materials
Materials are also inside the lagging quadrant on the weekly RRG and traveling a negative heading, like financials. Here, also, strength is needed from the daily teams to keep the sector inside the top five.
Materials are holding up on the price chart after a break that could be described as a head-and-shoulders reversal pattern. The relative strength line remains contained within the boundaries of its falling channel, but hugging the falling resistance line.
We need a break higher to turn that trend around. Only an upward breakout of that relative downtrend will turn the RRG lines around and provide a lifeline for materials to maintain its position inside the top five.
Portfolio Performance
The portfolio continues to lag the S&P 500, currently sitting around 8% behind. It seems to be stabilizing for now, but it’s not exactly what we want, of course. A drawdown of around 8-10% is not unprecedented, based on historical backtests; however, it’s somewhat disappointing that it occurs right when we begin operating in a semi-live environment.
That said, the fact that we’re now stable with no changes after a period of significant volatility over recent months could be a sign that we’re ready to enter a new period with stable relative trends that can bring the portfolio back to outperformance.
#StayAlert and have a great week. –Julius


