


Chartists can improve their odds and increase the number of opportunities by trading short-term bullish setups within bigger uptrends. The first order of business is to identify the long-term trend using a trend-following indicator. Second, chartist can turn to more granular analysis to find short-term bullish setups. Today’s example will use the Cloud Computing ETF (SKYY).
***********************
TrendInvestorPro monitors a carefully curated ETF ChartList to identify the leading uptrends and find bullish setups within these uptrends. We spotted several flag/pennant breakouts in tech-related ETFs in early June, and Palladium crossed our radar with a trend-following signal in late June. This week we identified several more bullish continuation patterns. Click here to take a trial and get access to our research.
***********************
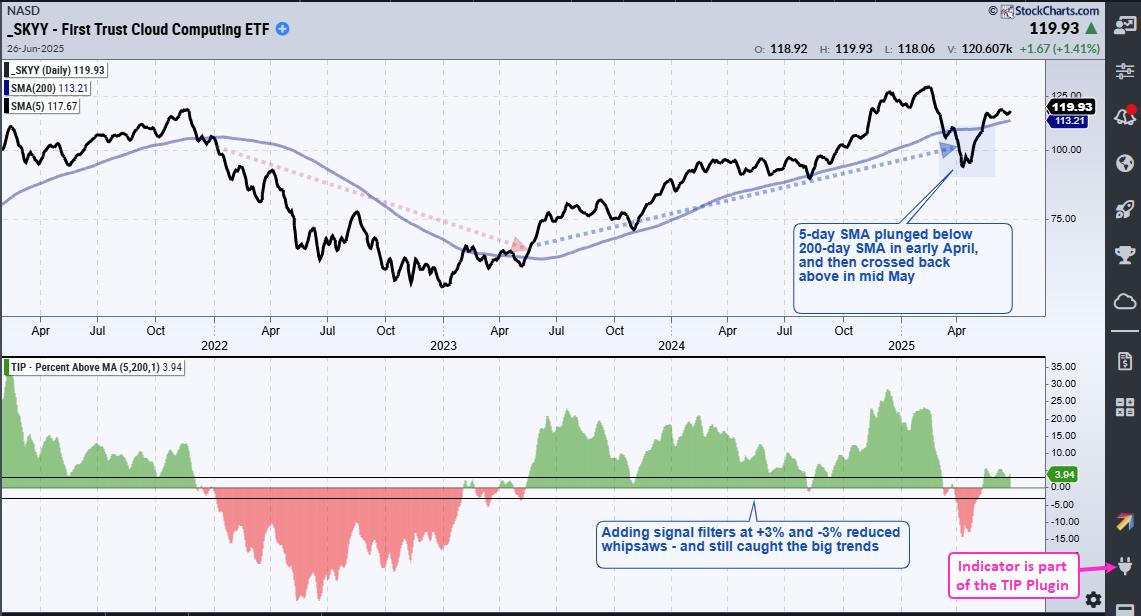
Returning to SKYY….First, and foremost, the ETF is in a long-term uptrend. The chart below shows the 5-day SMA and 200-day SMA only (no price plot). A downtrend signaled when the 5-day plunged below the 200-day in late March and early April. This downtrend signal did not last long as the 5-day surged back above the 200-day SMA on May 13th. Whipsaws suck, but they are part of the trend-following process.
The indicator window shows a method to reduce whipsaws – and still ride the big trends. Percent above MA (5,200,1) shows the percentage difference between the 5 and 200 day SMAs. I added signal lines at +3% and -3%, which means the 5-day must be more than 3% above/below the 200-day for a signal. This simple filter greatly reduced whipsaws and still caught the big trends. The red dotted line shows the downtrend from January 2022 to May 2023, while the blue dotted line shows the uptrend from May 2023 to April 2025. This indicator is one of 11 in the TIP Indicator Edge Plugin.
With a long-term uptrend in place and the tech sector leading the market, we can look for bullish setups on the bar chart. The next chart shows SKYY with a breakout surge from early April to mid May and a pair of short-term bullish continuation patterns. First, a pennant formed into early June and SKYY broke out. Second, a small flag formed into late June and SKYY broke out this week.
These breakouts signal a continuation of the April-May surge and target a challenge to the prior highs. A close below the rising 200-day SMA would argue for the first re-evaluation. The charts at TrendInvestorPro extend two years to offer longer term perspectives for the bigger trends and granular analysis for the shorter term setups along the way. The idea is to trade in the direction of the bigger uptrend.
Need some summer reading! Trial subscribers get full access to our Research & Education page, which has over a dozen reports. These cover the Zweig Breadth Thrust, trend-following signals, trailing stops and finding bullish setups. Check it out!
//////////////////////////////////////////////////


