


SIL Silver Miners
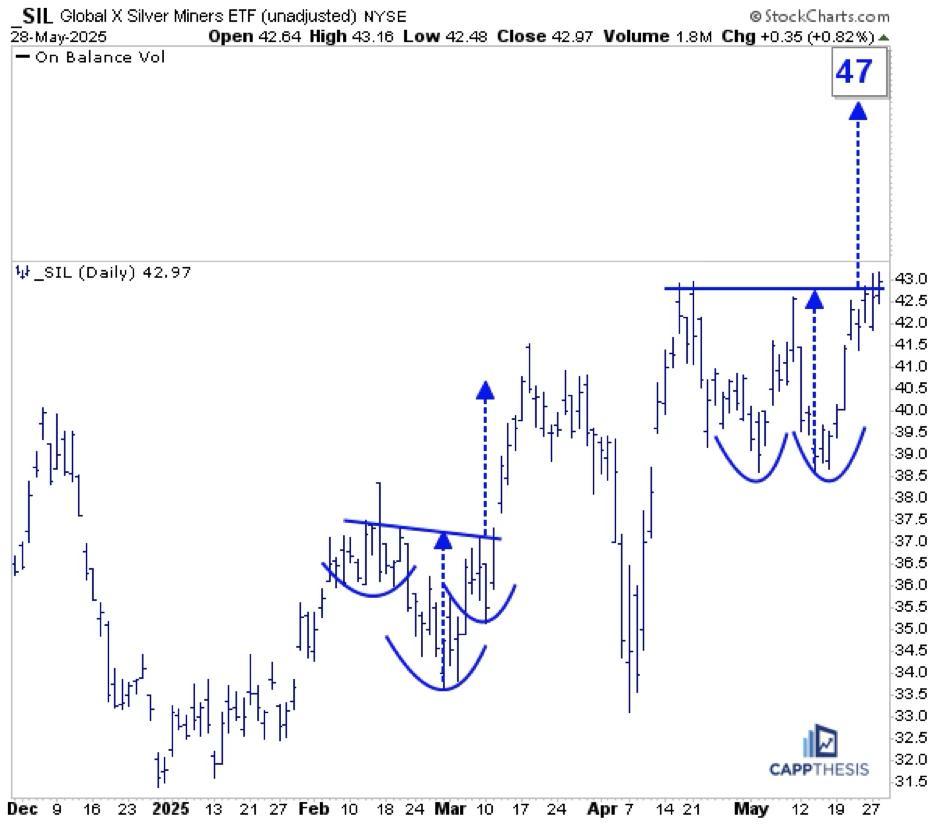
SIL was among the leaders yesterday and now is close to triggering this double-bottom bullish pattern. Staying above the 43-mark would target 47. That’s not a big move, but let’s remember that SIL is sporting bullish formations on its longer-term charts, too.
FIGURE 1. DAILY CHART OF GLOBAL X SILVER MINERS ETF (SIL).
SIL – Weekly
Firstly, the double-bottom pattern on this weekly log chart annotated in blue remains alive. This objective is up near 49.
Secondly, the area highlighted in green here is the same pattern pictured on the daily chart above. That area is sitting at the very top of a much bigger bullish inverse head-and-shoulders pattern that extends all the way back to 2021. Thus, if the short-term breakout works, it will trigger this one, as well. That target is in the mid-70s…
FIGURE 2. WEEKLY CHART OF GLOBAL X SILVER MINERS ETF (SIL).
SIL – Monthly
And that green pattern above is part of this MUCH larger, 13-year potential double bottom. We still have a while to go before this one is triggered, but it’s important to keep all of these in the back of our minds.
Anyone who trades or tracks SIL knows that short-term whipsaws are the norm. So, while these breakouts may not be clean, the bullish structures are clear. The bottom line is that if SIL continues to make higher highs and higher lows, the patterns will continue to work.
FIGURE 3. MONTHLY CHART OF GLOBAL X SILVER MINERS ETF (SIL).
USO Crude Oil
USO was among the leaders yesterday, but it’s still trying to bust through its 50-DMA, which has been the sticking point the last few weeks. If it can soon, USO could complete this potential bullish inverse H&S pattern. The upside target would be in the 77-78 range, and that would align with key short-term tops from the last year. First step, push above the 50-day line…
FIGURE 4. DAILY CHART OF US OIL FUND (USO).
NVDA
The obvious question every time NVDA rallies is whether it’s too late to buy. To get a true sense of the stock’s technical prospects, we need to view it across different charts and time frames.
First, here’s a view of the bullish flag pattern we cited on Tuesday (along with TSLA, GOOGL and META). Given the preceding staircase-like advance, the starting point of the flagpole is subjective. We’re using the early May low given that the stock avoided filling a gap from a few days earlier.
Regardless, the measured move counts to the 161 zone, which would be a new all-time high.
FIGURE 5. DAILY CHART OF NVIDIA CORP. (NVDA).
This second one is a daily chart that extends all the way back to 2010 and shows times when breaking below or above the 200-DMA led to strong, extended moves for the stock. From this angle, the recent 200-day breach didn’t last that long at all, and now NVDA has the chance to once again follow through after breaking back above it over the last few weeks.
FIGURE 6. LONGER-TERM DAILY CHART OF NVIDIA CORP. (NVDA).
Here’s a weekly, log chart going back to the 2022 low. NVDA has leveraged three major pattern breakouts since then to power the astounding rally the last two-plus years. With the stock last having made a new high last October and being net flat since last July, an eventual push back above the 150-zone could prompt big pattern-breakout number four.
FIGURE 7. WEEKLY CHART OF NVIDIA CORP. (NVDA).
Lastly, here are the biggest breakouts on this monthly chart that goes back over two decades. Again, looking at it from this viewpoint makes the last 11 months appear like a very small digestive phase, especially compared to the other three on the chart. Thus, the first step will be seeing how well NVDA can hold the opening gap. That’s important for today, but much more important for the days and weeks to come.
FIGURE 8. MONTHLY CHART OF NVIDIA CORP. (NVDA).


