


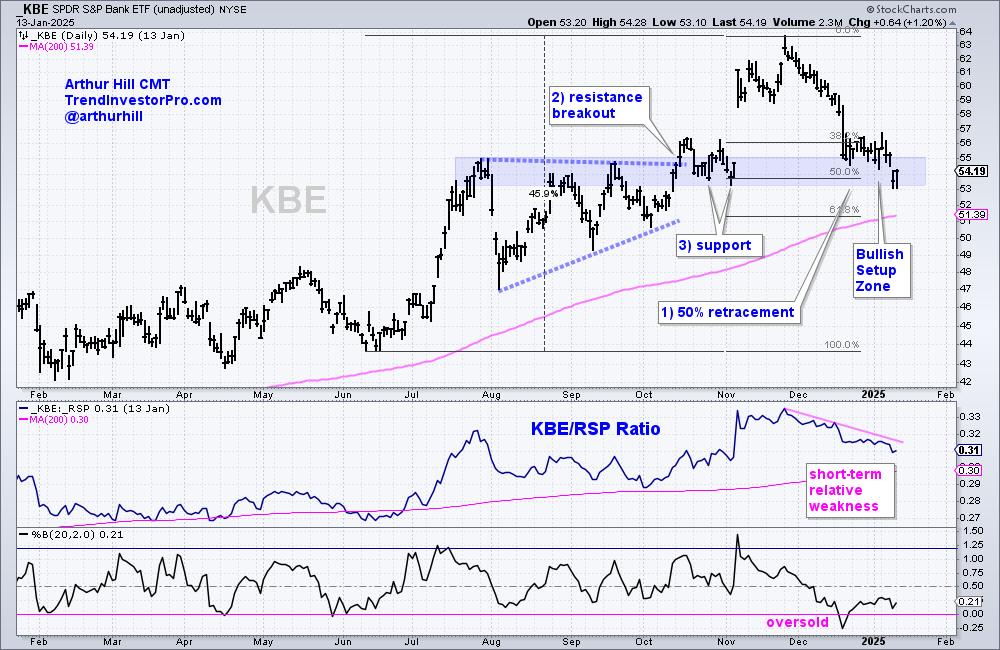
The Finance sector is leading the market with a new high this week and the Bank SPDR (KBE) is extending on its breakout. Today’s report will outline the lessons of the early January setup and show the mid January breakout. We then show how to set a re-evaluation level that would prove the breakout wrong.
Let’s first review the setup from mid January. The chart below shows KBE hitting a new high in late November and then falling into mid January. The new high affirms a long-term uptrend and KBE remained well above the rising 200-day SMA. Thus, this decline was viewed as a correction within a long-term uptrend. During such pullbacks, I look for Bullish Setup Zones using retracement levels, prior resistance breaks and support levels. These are zones to watch for firming and a reversal.
Three items mark the Bullish Setup Zone on the chart above (see 1, 2 and 3). First, corrections within uptrends typically retraced 1/3 to 2/3 with 1/2 (50%) being the base case. A 50% retracement represents one step backward after two steps forward. Second, a key tenet of technical analysis is that broken resistance levels turn into support. KBE broke resistance around 55 and this area turns into future support. Third, KBE held the 53 area with two bounces in late October and early November (support). Taken together, the 50% retracement, broken resistance and support mark a Bullish Setup Zone in the 53-55 area (blue shading).
The strategy at TrendInvestorPro is to find and trade pullbacks within leading uptrends. Each week we bring you setups in ETFs and stocks. Click here to take a trial and learn more.
Once prices reach the Bullish Setup Zone, it is time to start drawing patterns and marking resistance levels. KBE formed a falling wedge and established short-term resistance with the January 6th high (pink line). Note that falling wedge patterns are typical for corrections within bigger uptrends. KBE broke out with a gap-surge in mid January and extended higher into February. The indicator window shows the price-relative (KBE/RSP ratio) turning up with a relative breakout. KBE is also leading again.
With an active breakout and extension higher, it is time to mark a re-evaluation level. This is the level that negates the wedge breakout and tells us something is wrong. Strong breakouts should hold so a failed breakout shows weakness. The breakout zone in the 55-56.5 area turns into first support (blue shading). A close below 55 would negate this breakout and call for a re-evaluation.
The strategy at TrendInvestorPro is to find and trade pullbacks within leading uptrends. Each week we define the market regime (bull or bear market), identify the leading groups using ETFs and highlight tradeable setups in stocks and ETFs. This week we featured the three biotech ETFs, two biotech stocks, a Mag7 stock and an industrial stock. Click here to take a trial and gain full access.


