Overall Analysis
Bitcoin reached a new all-time high for the second consecutive trading session, continuing to fuel upside momentum. Ethereum successfully broke through its strongest resistance. Will it continue to rally further?Bitcoin Chart Analysis
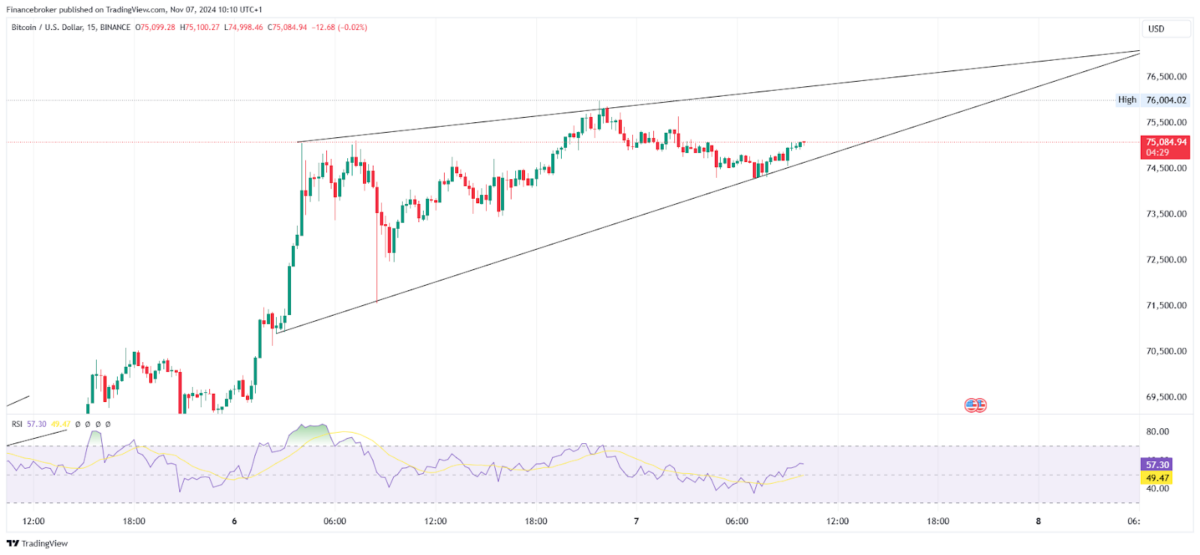
BTC/USD 15-Minute Chart (Source: TradingView)
On November 6, 2024, during the trading session, Bitcoin hit a new high of $76,004 and showed a strong upward move. However, the market was highly volatile, making it challenging for traders due to the ongoing US election. The market was choppy in the first half, with significant swings.
On an hourly time frame, prices are currently moving up within a channel. The RSI is in the ideal zone, making it favourable for accumulation. At the current level, the price is taking support and attempting to move higher.
On a 15-minute time frame, clear swing formations are visible. The price is currently moving within a rising wedge pattern and taking support from the trendline. When the price forms such a pattern, it can facilitate trading entries for traders.
If you’re looking for an entry trigger, consider the following:
If the price takes support from the trendline, entry can be made targeting the resistance trendline, with a trailing stop below the previous swing low. If the price breaks below the trendline and sustains under $74,318, a sell-side entry could be made with a stop loss above the previous swing high and a target of $71,574.Ethereum Chart Analysis
ETH/USD 15-Minute Chart (Source: TradingView)
On November 6, 2024, Ethereum surged upward, reaching its resistance level. The price is rising, supported by the trendline, and has successfully broken through the strong resistance zone of $2,774 to $2,719.
On a daily time frame, the crypto giants’ price has broken through a strong zone where it has been consolidating for the past 5 months. The daily price has not closed above $2,774 yet. If it sustains above this level, more buy-side opportunities may arise daily, potentially turning Ethereum’s sideways trend into an uptrend.
Currently, on the 15-minute time frame, the price is moving up, supported by the trendline, though it faces rejection near $2,821, a resistance area. Entry triggers are available from the 15-minute to daily time frames. Here are some triggers to consider:
If Ethereum closes above $2,774 on the daily time frame, positional traders could consider an entry. They should place a stop loss below the breakout candle and aim for a 1:2 minimum target. If the price breaks the supporting trendline on the 15-minute time frame and closes below $2,719, a sell-side entry could be made. Furthermore, Traders should set a stop loss above the previous swing high, with a target of $2,422. If, on the 15-minute time frame, the price takes support on the trendline, a buy-side entry could be made on the rejection candle. This entry should have a stop loss below the previous swing low, with targets at $2,924 and $3,000 levels.The post Bitcoin Hits All-Time High, Ethereum Breaks Key Resistance appeared first on FinanceBrokerage.


