Is SAP SE ($277B) on Track for Growth? SAP at $225.85
SAP SE (NYSE: SAP) was being traded at $225.85 on Wednesday, showing that its global software business was indeed very strong. The company’s market capitalisation has reached the mark of $277.46 billion, which speaks for itself as to how much of an influence it has on the enterprise technology sector. SAP, with a price-to-earnings (P/E) ratio of 48.99, signifies the strong investors’ trust for its long-term growth. Its price-to-earnings-growth ratio of 4.38 is quite high, showing expectations for less growth, whereas a beta of 1.25 suggests slightly more market volatility.
SAP SE share price was in the range of $127.30 to $231.13, going from a 52-week low to a high. This shows us a significant recovery. The company’s financial situation is still stable. Liquidity is demonstrated by a quick ratio and a current ratio of 1.12. It shows the company’s strong liquidity position. The low debt-to-equity ratio of 0.17 reflects a well-implemented and sensible leverage that the company has maintained.
SAP’s latest earnings report showed $1.10 earnings per share, surpassing analyst predictions of $1.01. The company’s product quality improved significantly, driving a 9.7% year-over-year revenue increase to $8.29 billion. The projections indicate a more predictable and quite upbeat annual growth of $4.78 per share. SAP’s proven capabilities and strong revenue growth record help it secure a place in the competitive enterprise software market.
Sap SE Chart
SAP SE Chart Analysis
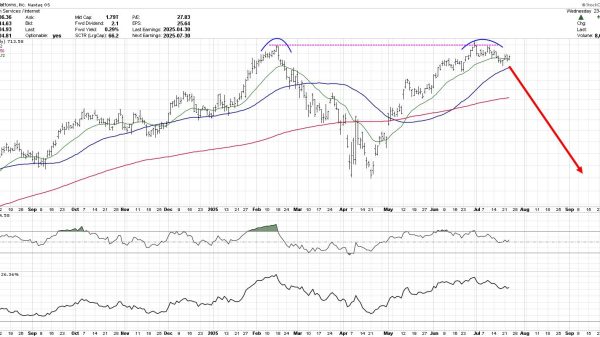
The stock’s recent chart shows volatility. The stock currently trades at $223.37, down 0.11%. It dropped below $230 in recent sessions. This was due to short-term selling pressure. The SAP SE stock price fell as low as $222. It then showed a slight recovery. This may signal the first sign of support at that level.
On the other hand, the stock is still struggling to reestablish the upward movement. In contrast to the regular trading volume, light trading volume indicates a cautious move on the part of the market. This particular thin point might actually be a result of a broader market slide, such as the scenario where investments in big tech companies such as SAP are at risk due to economic indicators.
For traders, it is interesting to see if the stock behaves around these keys. In the meantime, we, the long-term investors, might take this as an opportunity to add to our positions since SAP has strong growth potential.
Keep abreast of the market, keep an eye on key support levels, and buy shares at a discounted price to boost your portfolio with a reputable company like SAP!
The post SAP SE: $277B Giant’s Growth Trajectory at $225.85 appeared first on FinanceBrokerage.


