Utility stocks are now becoming cool. Going forward, AI companies will require massive power to amp up the innovative products and services they have in the pipeline. The amount of energy they need is way more than what’s available in the traditional energy sources. We’re talking nuclear energy.
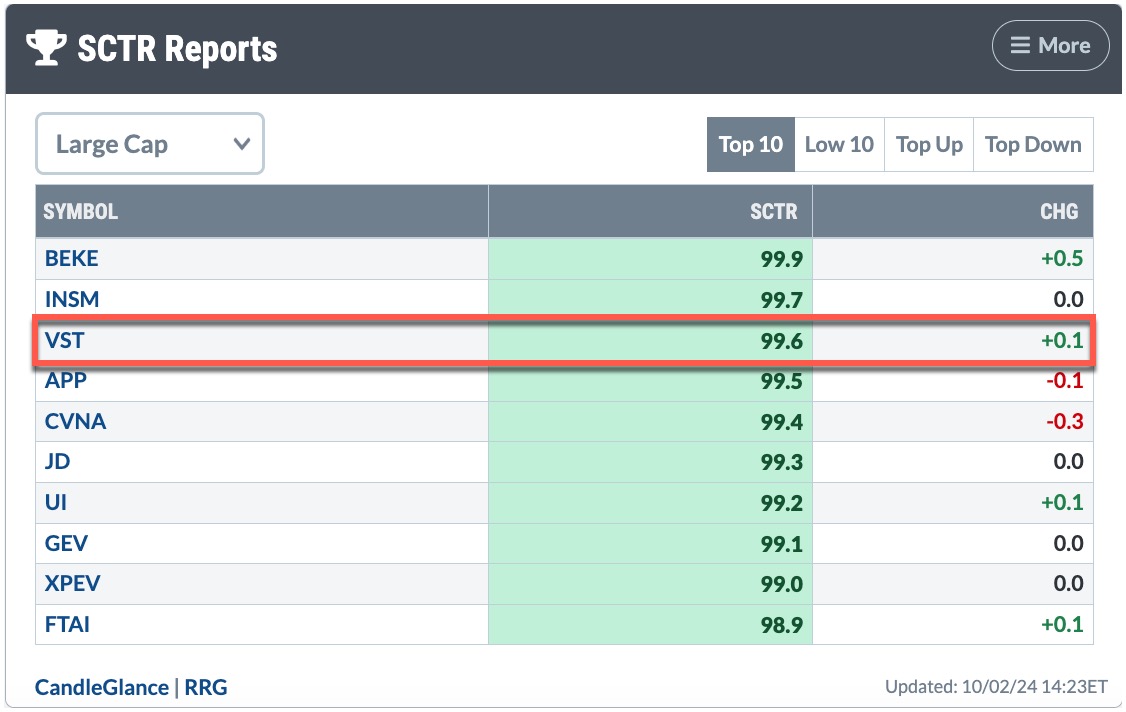
Vistra Energy Corp. (VST), which owns several nuclear plants, has seen its stock price rise 79.23% in the last six months. The stock has been in the top 5 StockCharts Technical Rank (SCTR: pronounced “scooter”) for a while and even briefly grabbed the top spot before giving up its lead.
FIGURE 1. VISTRA ENERGY IS IN PODIUM POSITION. Energy demand is expected to increase and will boost utility stocks.Image source: StockCharts.com. For educational purposes.Analyzing VST
Looking at VST’s three-year weekly chart, your first thought may be that it’s too late to take advantage of the rally. But look at what the stock price did at the end of July after it pulled back to its 30-week exponential moving average (EMA).
FIGURE 2. WEEKLY CHART OF VISTRA ENERGY. The stock pulled back to its 5 week EMA and bounced back higher.Chart source: StockCharts.com. For educational purposes.
The SCTR score dropped to below 70, then spiked back up. The relative strength index (RSI) is just above 70, which indicates that the stock price has more upside potential.
Switching to a daily chart, the RSI looks like it’s in oversold territory. A pullback is possible, especially given that volume is declining. However, the on balance volume (OBV) indicator is trending higher, showing momentum is still to the upside.
FIGURE 3. DAILY CHART OF VISTRA ENERGY. Watch the 5-day EMA and top horizontal blue-dashed line for potential reversals.Chart source: StockCharts.com. For educational purposes.
Remember, it’s October, and volatility tends to be elevated. If the S&P 500 ($SPX) pulls back, it’s worth considering VST as a “buy the dip” candidate. Stock prices don’t go up forever. They often pull back and can reverse and soar.
When’s a Good Time to Buy VST?
Ideally, a pullback to the 5-day EMA would probably be a good place to set an alert. This has been a support level during the September rise. If price falls below the EMA, the next support level would be just below $115 (dashed blue line). Watch momentum at these levels and see if there’s enough to send the stock price higher. VST pays out dividends, which is another advantage of owning the stock.
Closing Position
Add the daily and weekly charts of FXI to your StockCharts ChartLists and continue to monitor them. Set a StockCharts Alert to notify you when VST crosses below its 5-day EMA using the Advanced Alerts tool. When that alert is hit, watch the chart closely.
Your decision to enter a position depends on your risk tolerance level. Before placing the trade, identify your profit target and stop-loss level and be disciplined.
Disclaimer: This blog is for educational purposes only and should not be construed as financial advice. The ideas and strategies should never be used without first assessing your own personal and financial situation or without consulting a financial professional.


