


Top 5 Stocks in “Go” Trends
Trend Continuation on Rising Momentum
GoNoGo Charts® highlight low-risk opportunities for trend participation with intuitive icons directly in the price action. The resurgence of momentum in the direction of the underlying price trend is an excellent entry opportunity, or the chance to scale up positions.
GoNoGo Icons® illuminate these events on the chart with green solid circles (or red circle to highlight continuation of NoGo trends). When GoNoGo Trend® is painting blue or aqua bars, a green solid circle will appear below price each time GoNoGo Oscillator® finds support at zero.
Below are the top 5 stocks/ETFs in “Go” trends with surging momentum by volume in the S&P 500 as of the daily closing price action:
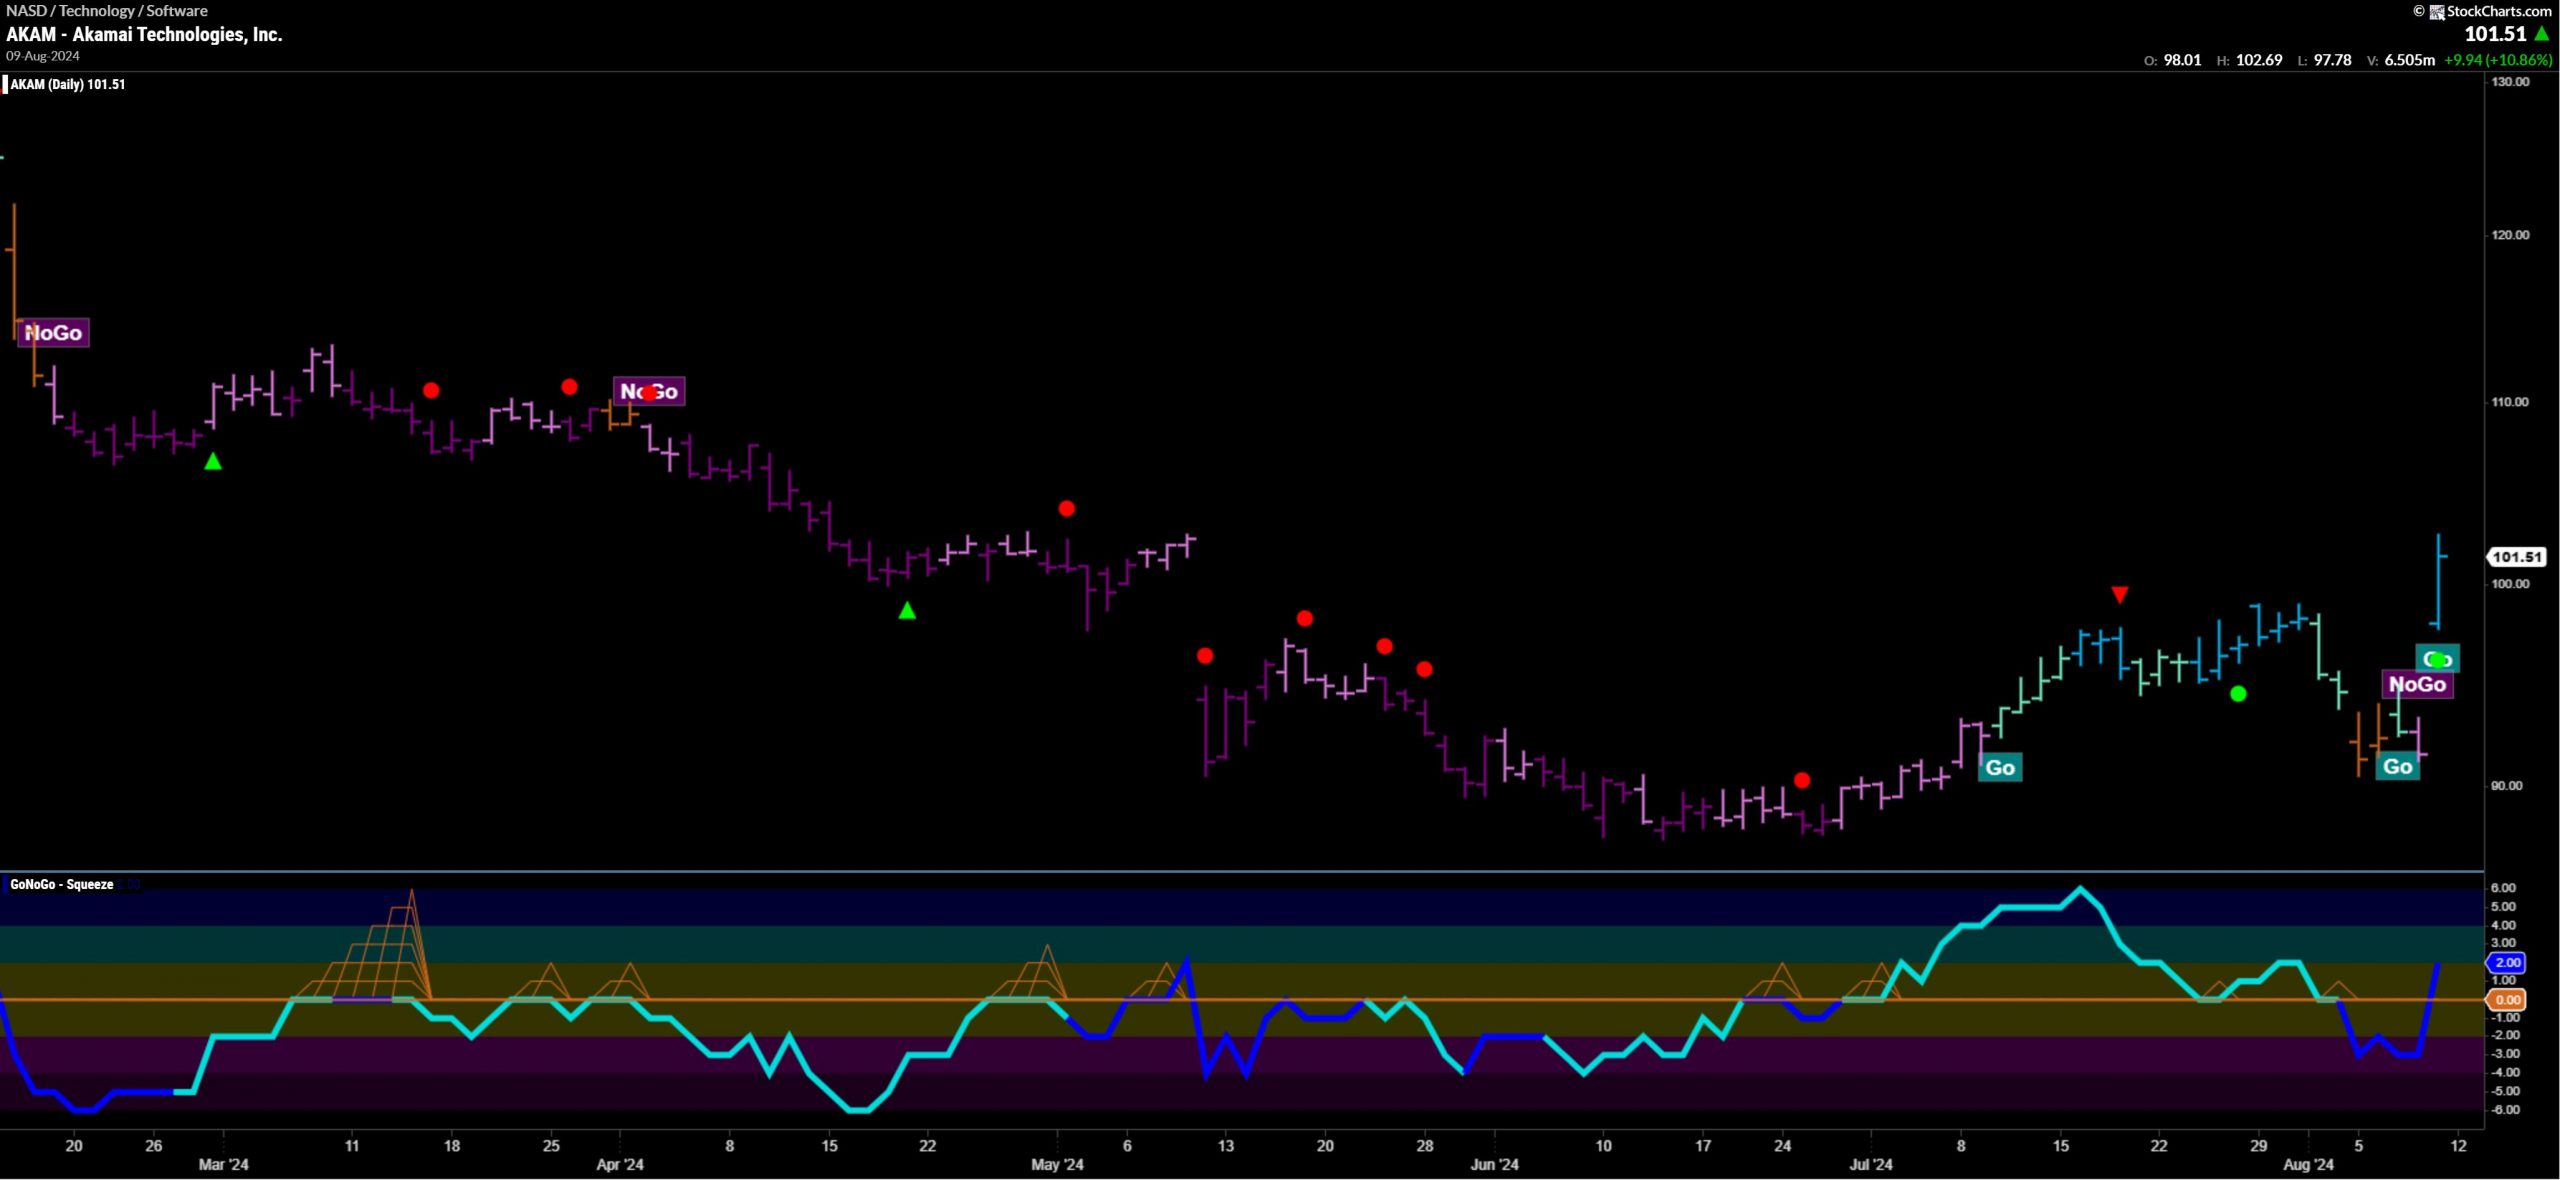
Akamai Technologies, Inc. (AKAM)
§ GoNoGo Icons signaled a trend continuation on Friday (08/09/24).
§ After a multi-month NoGo trend beginning in February, price action based at $88 and reversed to a Go trend in July.
§ After a retest during this week’s volatility, AKAM finished the week on strong “Go” conditions after gapping higher on a blue bar.
§ GoNoGo Oscillator broke out from below the zero line ending at positive 2 on Friday.
§ AKAM has traded on heavy relative volume all week.
Raytheon Technologies Corp. (RTX)
§ GoNoGo Trend held weak form “Go” conditions this week on pale aqua bars.
§ GoNoGo Icons signaled a trend continuation on Friday (08/09/24).
§ GoNoGo Oscillator ended the week in positive territory after retesting the zero line and finding support.
Healthpeak Properties, Inc. (DOC)
§ GoNoGo Trend sustained “Go” conditions throughout the trading week.
§ GoNoGo Icons signaled a trend continuation on Tuesday and Friday (08/09/24) as momentum found support at neutral
§ GoNoGo Oscillator ended the week in positive territory after testing the zero line on heavy relative volume.
United Dominion Realty Trust (UDR)
§ GoNoGo Trend returned to strong blue “Go” conditions after painting a pink NoGo bar during Monday’s selloff.
§ This recovery follows weakening trend conditions and corrective price action in late July.
§ GoNoGo Icons signaled a trend continuation on Friday (08/09/24).
§ GoNoGo Oscillator recently dipped into negative territory, but recovered positive momentum conditions on Friday.
Progressive Corp. (PGR)
§ GoNoGo Trend ended the trading week on strong blue “Go” conditions.
§ GoNoGo Icons signaled a trend continuation on Friday (08/09/24).
§ GoNoGo Oscillator has built three max squeeze conditions as price action became range bound through the summer months.
§ Momentum delivered a false breakdown on Monday before breaking back into positive territory again on Friday. |


