


Top 5 Stocks in “Go” Trends
Trend Continuation on Rising Momentum
GoNoGo Charts® highlight low-risk opportunities for trend participation with intuitive icons directly in the price action. The resurgence of momentum in the direction of the underlying price trend is an excellent entry opportunity, or the chance to scale up positions.
GoNoGo Icons® illuminate these events on the chart with green solid circles (or red circle to highlight continuation of NoGo trends). When GoNoGo Trend® is painting blue or aqua bars, a green solid circle will appear below price each time GoNoGo Oscillator® finds support at zero.
Below are the top 5 stocks/ETFs in “Go” trends with surging momentum by volume in the S&P 500 as of the daily closing price action:
Uber Technologies, Inc. (UBER)
§ GoNoGo Icons signaled a trend continuation on Friday (06/28/24).
§ After a sharp reversal in early June, price climbed higher finishing the week on strong “Go” conditions painting blue bars.
§ GoNoGo Oscillator found support at the zero line twice this week, before rising positive on Friday.
§ Uber has traded on light relative volume for the past six weeks.
J. P. Morgan Chase & Co. (JPM)
§ GoNoGo Trend returned to “Go” conditions this week following a period of corrective No Go and amber neutral conditions.
§ GoNoGo Icons signaled a trend continuation on Friday (06/28/24).
§ GoNoGo Oscillator ended the week in positive territory after breaking out of a GoNoGo Squeeze.
§ Volume was heavy throughout the rally.
Williams Cos., Inc. (WMB)
§ GoNoGo Trend sustained “Go” conditions, though it softened to weak form aqua bars to end the trading week.
§ GoNoGo Icons signaled a trend continuation on Friday (06/28/24).
§ GoNoGo Oscillator ended the week in positive territory after testing the zero line on heavy relative volume.
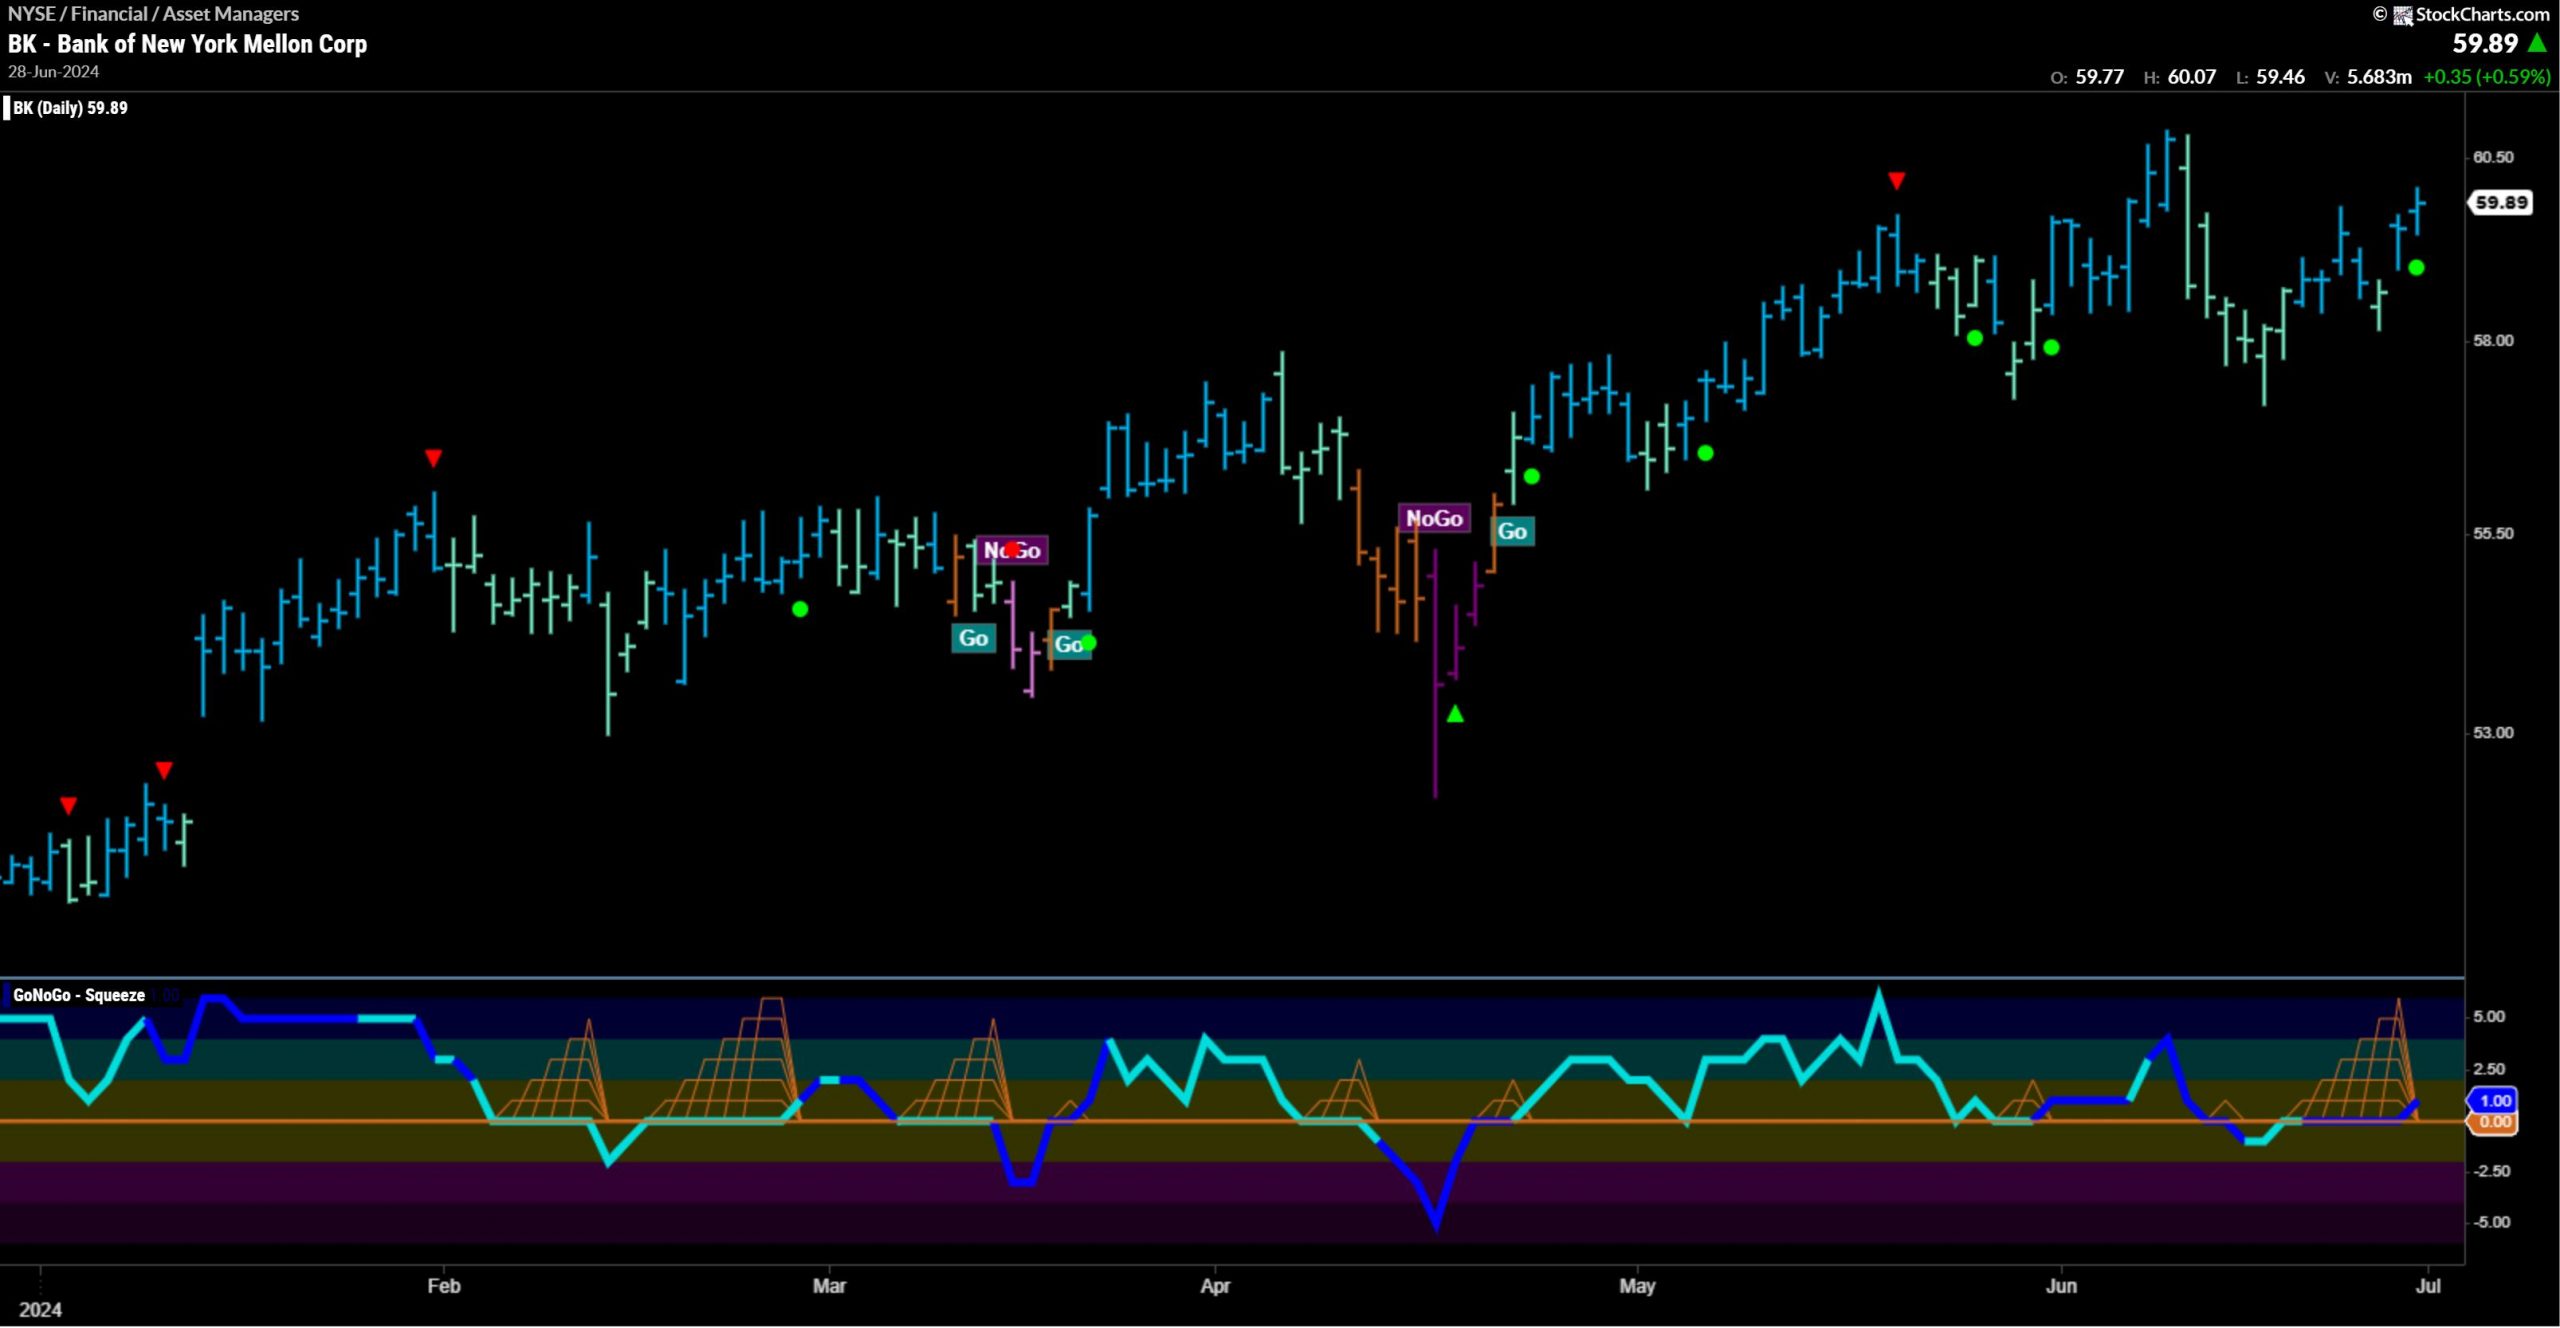
Bank of New York Mellon Corp (BK)
§ GoNoGo Trend returned to strong blue “Go” conditions to end this trading week.
§ This recovery follows weakening trend conditions and corrective price action in early June.
§ GoNoGo Icons signaled a trend continuation on Friday (06/28/24).
§ GoNoGo Oscillator ended the week in positive territory after breaking out of a GoNoGo Squeeze.
§ Momentum broke to positive territory on Friday, rallying on heavy relative volume.
International Business Machines (IBM)
§ GoNoGo Trend ended the trading week on weaker form aqua “Go” conditions.
§ GoNoGo Icons signaled a trend continuation on Friday (06/28/24).
§ GoNoGo Oscillator broke out of a max squeeze, before retesting zero this week and breaking back into positive territory again on Friday.
§ IBM is trading on heavy relative volume.
GoNoGo Charts Plug-In Available for StockCharts ACP


