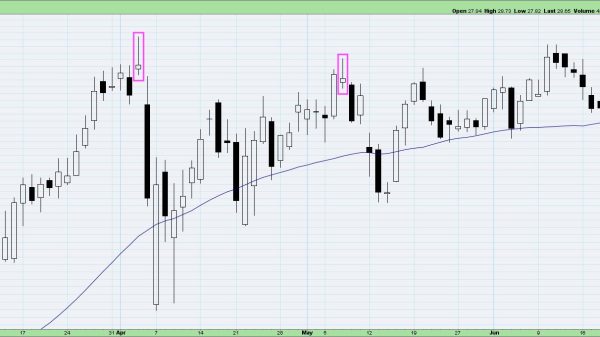
What Is An Abandoned Baby Pattern?
The abandoned baby pattern is a distinctive candlestick pattern that experienced traders keep an eye out for, as it frequently indicates possible changes in market direction. This pattern can occur in both upward and downward trends, and comprehending its intricacies can assist traders in making well-informed choices.
What is the Abandoned Baby Candlestick Pattern?
The abandoned baby candlestick is made up of three candles. The middle candle is a doji, with the open and close prices nearly identical, showing uncertainty in the market.
This doji is sandwiched between candles with larger bodies, and importantly, there are spaces between the doji and these neighboring candles. These gaps are significant as they signify a sudden change in market sentiment, making this pattern a powerful indication of possible reversals.
Types of Abandoned Baby Patterns
There are two primary variations of this pattern: the bearish and bullish abandoned baby doji candlestick formations.
The Bullish Abandoned Baby candlestick pattern occurs when a bullish candle forms after a doji candle, following an abandoned baby candlestick pattern during a downtrend. This pattern suggests that the downward momentum may be weakening, potentially signaling the beginning of a bullish trend.
In contrast, the bearish abandoned baby pattern emerges in a market trending upward. It begins with a bullish candle, then a doji, and ends with a bearish candle.
This formation suggests that the uptrend could be coming to an end, signaling a possible shift to a bearish trend.
Psychological Interpretation
Abandoned baby chart pattern serves as a mirror of the sentiment among the traders. This pattern usually depicts a considerable change in psychology of traders.
It shows uncertainty following a strong market trend. The market gap shows an abrupt change in market sentiment among the majority of traders. Once you spot this pattern, it’s a clear sign that the prior trend could be exhausting itself.
Market Conditions for the Abandoned Baby Pattern
Some market conditions should be met so we can spot the abandoned baby. It often occurs at the peak of the strong price move, be it up or down.
The most important condition is a very volatile trend in the market. Fast shifting in closing and open prices that create market gaps are vital so that this pattern occurs in the graph. Also, appearance of close moving averages can affect the formation and also confirmation of this pattern.
Confirmation and Validation
In general, abandoned babies represent very strong trading signals. However it’s wise to always look for the confirmation of the trend before acting.
You can find the trend confirmation in the next candle following the pattern formation in the predicted direction of the reversal trend.
Establishing risk-reward ratios and placing stop loss are crucial once the pattern occurs.
Trading Strategies Based on the Abandoned Baby Pattern
Before entering the trade, once you spot an abandoned baby in the graph, make sure that you have trend confirmation. Once it’s validated, traders can open a position in the new trend’s direction. Now let’s see how to strategies in case of bearish and bullish abandoned babies.
Bullish Abandoned Baby: Place a buy order after the bullish candle that comes after the doji. Place a stop loss slightly below the lowest point of the bearish candle or the doji. Determine the target by looking at past resistance levels or setting a specific profit goal.
Bearish Abandoned Baby: Once the bearish candlestick pattern is complete, consider opening a short position. Set a stop loss slightly above the highest point of the previous bullish candlestick or doji. When determining your exit strategy, target a level where past support could potentially act as resistance.
Limitations and Considerations
Although this pattern may be compelling to use, it does have its drawbacks. In highly liquid markets, the gaps in the pattern may close quickly, which could nullify the signal of a trend reversal.
Additionally, because this pattern is not common, it is not advisable to rely solely on it without support from other analytical methods or indicators, as this could result in missing out on potential opportunities or receiving inaccurate signals.
Similar Patterns
The bullish and bearish abandoned baby patterns closely resemble the evening star and morning star formations.
What sets it apart is the rare presence of a doji candle with gaps on both sides. In contrast, the evening star and morning star formations do not necessarily include a doji candle or gaps on either side.
The term “doji” originates from the practices of rice traders in Japan, along with many other candlestick pattern names.
Steve Nison introduced this term to the mainstream media in 1991, although it has been used in Japanese trading for many years. This pattern bears resemblance to the island reversal bar-chart pattern, but is distinguished by its formation with just one candle.
Bottom Line
The abandoned baby candlestick pattern is a powerful tool in the trader’s toolkit, signaling potential reversals with a good degree of reliability.
Whether bearish or bullish, these patterns provide insights into market dynamics that, when confirmed and traded properly, can lead to profitable outcomes.
By understanding the psychological and technical aspects of this pattern and incorporating strict risk management strategies, traders can use the abandoned baby to navigate the complexities of the market effectively.
The post What Is An Abandoned Baby Pattern? appeared first on FinanceBrokerage.


