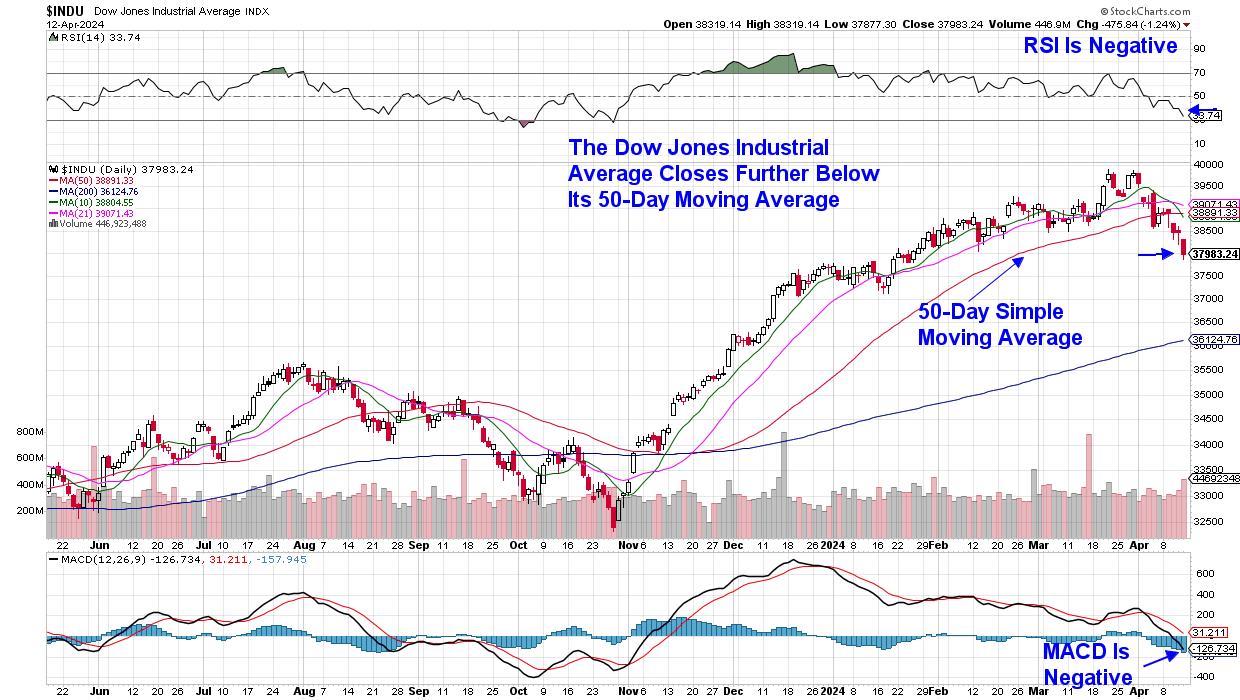
The Dow Jones Industrial Average fell 2.4% last week in a move that pushes this index further below its key 50-day simple moving average. While not the most widely followed index, the Dow has continued to evolve so that its 30 components more closely represent the current economy. Amazon’s (AMZN) inclusion at the end of February is the latest modification, where it joins Apple (AAPL), Microsoft (MSFT), and Salesforce (CRM) to name just a few of the heavier-weighted names.
Daily Chart of Dow Jones Industrial Average
Leading this index lower last week was a 7.4% decline in J.P. Morgan Chase (JPM), which fell following the release of their first quarter earnings on Friday. While the company’s results were strong, CEO Dimon’s tepid outlook for growth going forward pushed the stock lower. Among the risks cited by management were high inflation and the potential for the Federal Reserve to tighten monetary policy. Geopolitical risks were also mentioned.
Most notable on JPM’s chart, however, was the fact that it was trading at a new high in price prior to the release of their report. In other words, the stock was priced for perfection, such that any hint of a possible slowing of growth pushed the stock sharply lower.
Currently, we are at the very beginning of earnings season and, should we see a similar reaction to well-known companies reporting results while their stock is priced at a near-term high, we could be in for some tough sledding. Netflix (NFLX) is the next well-known company due to report next week, followed by Microsoft (MSFT), Alphabet (GOOGL), and Meta Platforms (META) the following week. Each of these stocks are trading at near-term highs and are susceptible to weakness amid any talk of a rise in interest rates.
Comparative Chart of Dow, S&P 500 and NASDAQ – June 2023-Current
Above is a comparative chart of the Dow Jones Industrial Average versus the S&P 500 and the NASDAQ Composite. As highlighted, the Dow led the markets into a new uptrend, which began in early November. More recently, many of those winning stocks from the Dow are now in downtrends, after closing below their key 50-day simple moving average.
These winners were from a broad cross-section of sectors, such as Industrials, Financials, and Consumer Discretionary, and include Home Depot (HD) and J.P. Morgan (JPM), to name just two. My screening showed the weakness that had been spreading in these sectors, as I removed several Retailers from my MEM Edge Report Suggested Holdings List over the past several weeks and took off Bank stocks earlier this week. The deterioration among these Discretionary, Financial, and Healthcare stocks from the Nasdaq and the S&P 500 may be harder to spot, given the large number of names in their index; however, my MEM Edge Report has been detailing the weakness for weeks now.
Most important at this time is the fact that both the Nasdaq and S&P 500 are hovering above key support, and you’ll want to preserve profits should we see a downtrend develop. While interest rates are a key determinant of investor sentiment, earnings reports have been proven to be more impactful. If you’d like to be kept up to date on the condition of the broader markets, as well as how to handle stocks depending on your investment horizon, use this link here to access my twice weekly report for 4 weeks for a nominal fee.
Warmly,
Mary Ellen McGonagle
MEM Investment Research


