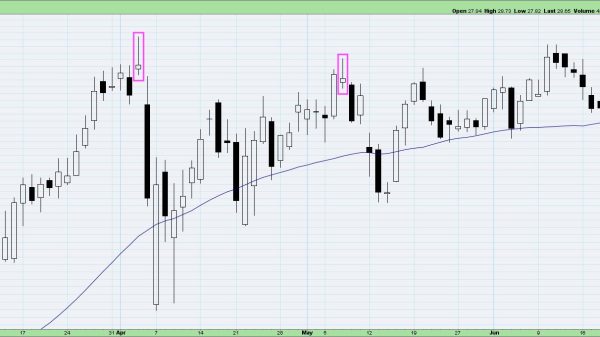
S&P 500 and Nasdaq: S&P 500 remains below resistance 5220.0
The S&P 500 index is pulling back from this week’s resistance zone at 5220.0. The Nasdaq index retreated on Wednesday to the 17862.8 level, thus testing last week’s support zone.S&P 500 chart analysis
The S&P 500 index is pulling back from this week’s resistance zone at 5220.0. A strong dollar index contributed to this, as well as rising inflation in the US. So, on Wednesday, we saw a pullback to 5128.7 levels. On Thursday, we consolidated there and recovered to the 5210.0 level. During this morning’s Asian trading session, the index managed to stay above the 5195.0 level.
After that, in the EU session, bearish consolidation begins and falls to the 5170.0 level. We are now under pressure to continue down to previous support. Potential lower targets are 5160.0 and 5150.0 levels. We need to get back above the 5210.0 level for a bullish option again. Thus we climb above the EMA200 moving average and the weekly open price. If we manage to stay up there, we will have good support for further recovery.
Nasdaq chart analysis
The Nasdaq index retreated on Wednesday to the 17862.8 level, thus testing last week’s support zone. Like last week, and this time, we are getting support at the same level. On Thursday, we see a recovery from that zone to the 18337.0 level. During this morning’s Asian session, the index slowly began to retreat to 18200.0. Here, we meet the EMA50 moving average, and we could hope for its support.
Potential lower targets are the 18100.0 and 18000.0 levels if the price breaks below. For a bullish option, we need positive consolidation and moving average support. With that, we are setting ourselves up for a new impulse that would move us to the bullish side. We are again looking at the 18320.0 resistance zone as an obstacle to our recovery. Potential higher targets are 18360.0 and 18400.0 levels.
The post S&P 500 and Nasdaq: S&P 500 remains below resistance 5220.0 appeared first on FinanceBrokerage.


