


If you ran a StockCharts scan for Runaway Gaps (Runaway Gap Ups) on Thursday, you would have come across only 12 stocks. Among them, the most recognizable name was Novo Nordisk A S (NVO), the Danish pharma company best known as the developer of the popular diabetes II drug, Ozempic.
Having already gained 26% since January, NVO jumped over 9% after reporting successful early trial results for its new weight loss drug, amycretin. Trial participants who took the drug achieved an average weight loss reduction of 13.1% over a 12-week period.
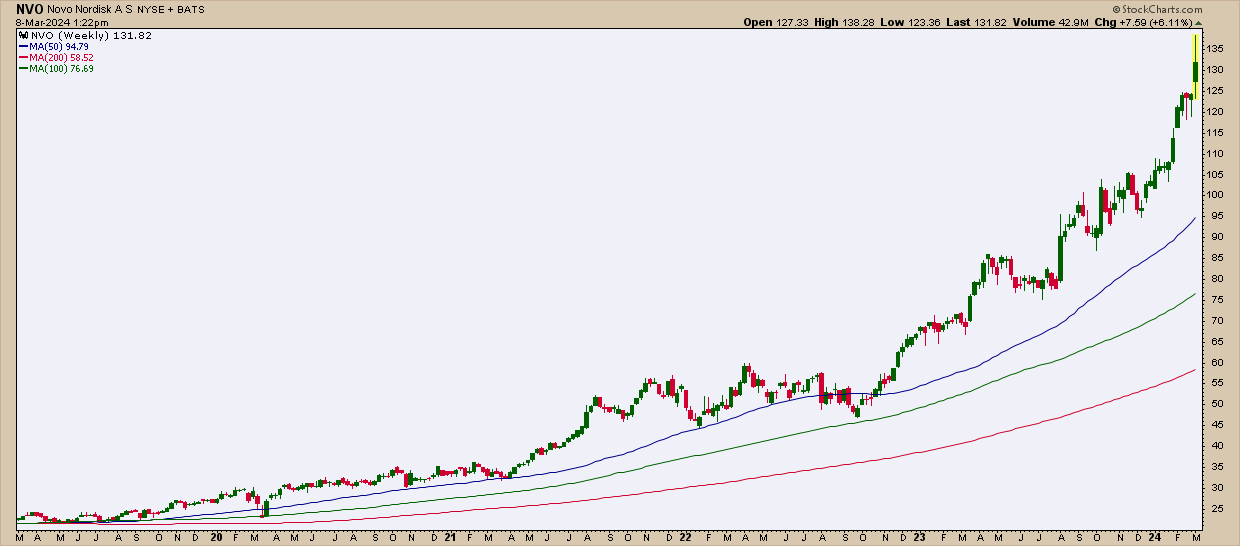
Wall Street sentiment is betting on the possibility that this new drug will be just as big as, if not bigger than, Ozempic, and some investors want to get in early. It’s easy to see why by simply looking at a weekly chart plotted over five years, covering the time when Ozempic became mainstreamed not only as a diabetes drug, but as a weight loss drug.
CHART 1: WEEKLY CHART OF NOVO. Notice the significant strength and momentum of the uptrend over a five-year period. The demand for weight loss is virtually “inelastic” these days.
Looking at the 50-, 100-, and 200-week Simple Moving Averages, not only are have they been fanning-out in full sail since Ozempic ads have began penetrating the mainstream consciousness, but NVO appears to be stretching the MAs to breaking point (if you can imagine such a thing), defying gravity with only the slightest indication (yet) of a potential pullback.
The daily picture gives us a clearer picture, not only of the strength of NOV’s performance, but of potential entry points should you want to go long.
CHART 2. DAILY CHART OF NVO. Not only does this look like a microcosm of the longer-term weekly chart, it also illustrates a similar trend relative to the broader market, its sector, and industry.
Runaway gaps, characterized as strong bullish continuation patterns, are located in the middle of a trend. But trends can only be confirmed looking backwards; we’re not there yet. So, are we looking at an exhaustion gap instead, one on the verge of a pullback?
Note the divergence between NOV’s price surge and the Money Flow Index (MFI) reading. As a volume-weighted RSI of sorts and an indicator to gauge momentum and anticipate possible reversals, the divergence we’re seeing hints at a potential dip in NVO’s share price.
Despite this, note NVO’s strong outperformance relative to the S&P 500 (+17%), its own sector via SPDR Health Care Select Sector Fund XLV (+20%), and the Dow Jones U.S. Pharmaceuticals Index or $DJUSPR (+23%).
The 50-day SMA and the Kumo segment of an Ichimoku Cloud has been plotted to show a potential landing point if a pullback were to occur. And if NVO were to pull back now, drawing a Fibonacci retracement from the October 2023 low would give us a 50% level right at $112.50, so we’re looking at the range, mostly covered within the “cloud.”
The Bottom Line
But here’s where you really have to think for yourself. Ozempic fever drove NVO’s seven-year uptrend, and arguably, it isn’t over yet. The most recent surge is driven by sentiment and speculation surrounding that amycretin will bolster and continue NVO’s winning streak. The $112 to $118 range may be a reasonable “technical” entry point, but with a PEG (Price to Earnings to Growth) ratio of 4.87, it’s far from being undervalued.
How to Run a StockCharts Scan
Finding the right stocks and exchange-traded funds (ETFs) to trade can be tricky. But with a little work, you can create a strategy that identifies a few promising prospects.
Fortunately, it isn’t too hard to learn how. Just stick to these steps:
Select (or create) a few different scan criteria Be sure to run these scans regularly Analyze the stocks (or ETFs) that your scan has identified Determine your overall trading setup (including your entry and exit criteria)The StockCharts Scan Engine is useful for narrowing down stocks and ETFs that match certain requirements. It comes with a bunch of ready-made scans that are a good starting point. As you get the hang of these scans, you can adjust them or create new ones that align with your trading goals.
For example, this article was prompted by a Runaway Gap Ups scan. As you can imagine, there are plenty more scans you can run. Try out the StockCharts Sample Scan Library (Charts & Tools > Sample Scan Library)


