


This secular bull market advance is running over everyone attempting to get in its way. It’s why I always say never to bet against one. Trying to short this type of bull market is the equivalent of financial suicide. I usually have music playing in the background while I’m working and, on Friday, as the stock market closed, Elton John’s “I’m Still Standing” started playing. I thought, “WOW, this is timely!” EVERYTHING has been thrown at this secular bull market and it’s still standing, “better than it ever did.”
Resiliency is a key element of bull market moves and we’ve certainly witnessed that. But, bull market or not, we absolutely should lower our bar of expectations right now. I would definitely remain fully invested, but just try not to grow too bearish when we inevitably enter a period of consolidation or (gasp!) selling. The first half of calendar quarters 1-3 is historically MUCH more bullish than the second half of calendar quarters 1-3. During the current secular bull market that began in 2013, here’s the S&P 500 breakdown by annualized returns by calendar quarters 1-3:
1st half of calendar quarters 1-3: +18.14% 2nd half of calendar quarters 1-3: -3.37%That’s a very large discrepancy in performance and it’s calculated over 11+ years of data. We know what’s been driving our major indices higher. It’s been the Magnificent 7 and friends. In a 70-page Seasonality PDF that I’ve offered to everyone on 16 of the largest market cap companies, a TON of seasonal information was shared on each. Following the theme of 1st half vs. 2nd half of calendar quarters, let me share with you the annualized returns for both halves for each of these 16 companies:
1st Half of Calendar Quarters 1-3:
AAPL: +50.54% MSFT: +37.67% GOOGL: +50.42% AMZN: +51.51% NVDA: +75.63% META: +56.44% TSLA: +62.69% AVGO: +18.26% COST: +25.50% ADBE: +33.82% CSCO: +18.85% AMD: +72.48% NFLX: +47.21% INTC: -1.11% AMGN: +21.81% SBUX: +17.13%2nd Half of Calendar Quarters 1-3:
AAPL: +9.52% MSFT: +12.35% GOOGL: -8.70% AMZN: +13.29% NVDA: +47.80% META: +8.93% TSLA: +40.41% AVGO: +40.21% COST: +9.64% ADBE: +20.37% CSCO: +2.69% AMD: +26.77% NFLX: +19.45% INTC: +13.98% AMGN: +2.52% SBUX: -4.05%Of these 16 stocks, only AVGO and INTC perform better during the 2nd halves of quarters.
I deliberately ignored Q4, because this quarter has a long history of seeing considerable strength during both halves. But in quarters 1-3, we should simply recognize the historical patterns and be sure to lower our expectations, especially after such a significant rally since late-October 2023.
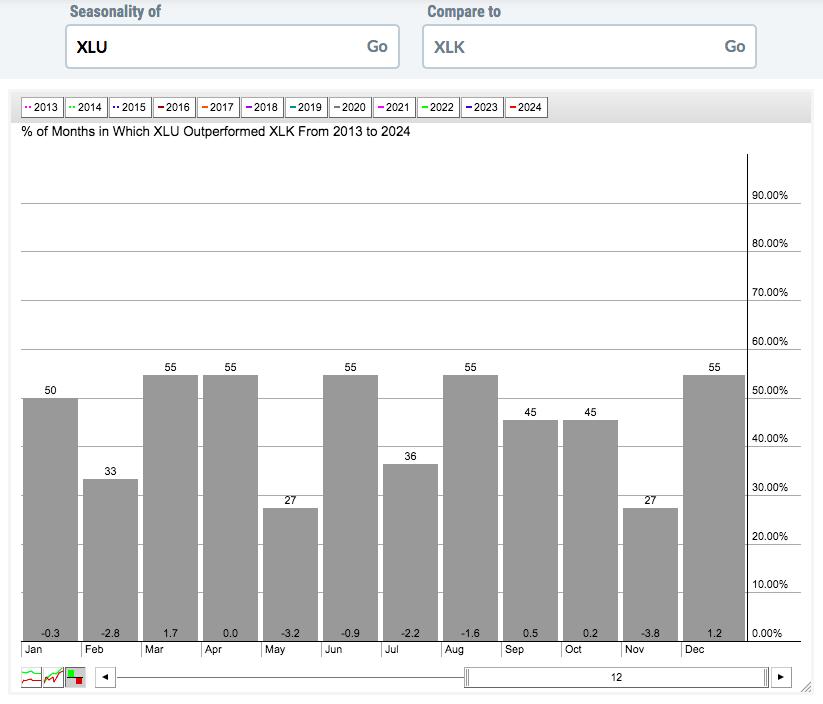
We’re still seeing a “risk on” market environment, which favors the bulls. If we begin to see relative strength in more defensive sectors, that could be the signal to perhaps take on less risk. Using StockCharts.com’s seasonality tool, we can compare defensive utilities (XLU) vs. ultra-aggressive technology (XLK) since 2013:
Utilities don’t outperform technology very often, but it seems to happen somewhat frequently in the 3rd months of calendar quarters. Check out March, June, September, and December above. March is the best calendar month for XLU outperformance vs. the XLK. But the second months, February, May, August, and November, favor technology in a HUGE way!
Now let’s look at consumer staples (XLP, defensive) vs. consumer discretionary (XLY, aggressive), using the same seasonality chart since 2013:
Again, it’s the third months of calendar quarters where defensive areas show some relative strength and the second months where we’ve seen MASSIVE relative weakness. We need to recognize these seasonal patterns to become better traders, knowing when it’s appropriate to take on more risk…..and when it’s not.
Based on all of this, it seems rather prudent to me to be a bit more cautious now. I’m not at all saying that our major indices are primed for a big fall. Instead, I’m simply pointing out that we’re in a time of the year when risk does escalate. It’s up to each individual as to what that might mean in your own trading and/or investing.
By the way, I am still offering the “Bowley Trend”, our seasonal PDF, for FREE. CLICK HERE and claim your copy!
Happy trading!
Tom


