

Stock
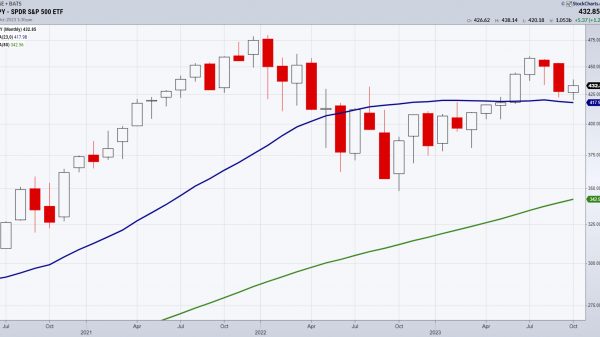
CHART 1: MONTHLY CHART OF SPDR S&P 500 ETF (SPY). Considering everything: Yields and mortgage rates War Inflation and rising commodity prices Bank stocks...

Hi, what are you looking for?

US stock ownership disparity: 62% of Americans invested, unequal distribution raises questions
Long AVGO: leveraging AI-driven growth and strong technical setup for potential breakout towards new highs

Texas sues GM for allegedly selling drivers’ data without consent

Mars acquires Kellanova for $36 billion, adds Pringles and Cheez-It to its portfolio

Goldman Sachs upgrades nCino to Buy with $42 price target: Should you invest?

Iridium to Collaborate with Nordic Semiconductor on Iridium NTN Direct integration

Quectel BG770A-SN Combines 5G and NTN Support in Ultra-compact New Module

Ethereum is still under pressure from the EMA 200 today

Gold and Silver: New Weekly Lows and Potential Targets

S&P 500 and Nasdaq: New Targets and Prices for Wednesday

Over 5,700 children in 5-year period had gender surgeries, most from 5 liberal states: watchdog
Trump has 9-point lead on most important issue to voters: poll
As Gaza war drags past 1 year mark, hope fades for a deal to bring hostages home soon

5 key numbers that will decide the 2024 presidential election
‘Abandon Harris’ group endorses Jill Stein over ‘pro-genocide candidate’ Kamala Harris
CHART 1: MONTHLY CHART OF SPDR S&P 500 ETF (SPY). Considering everything: Yields and mortgage rates War Inflation and rising commodity prices Bank stocks...


The global Forex exchange market experienced a mixed trading session as upbeat US economic data collided with a cautious Wall Street sentiment. Key developments...


The concept of smart cities is rapidly becoming a reality, thanks to the transformative power of the Internet of Things (IoT). IoT is fundamentally...
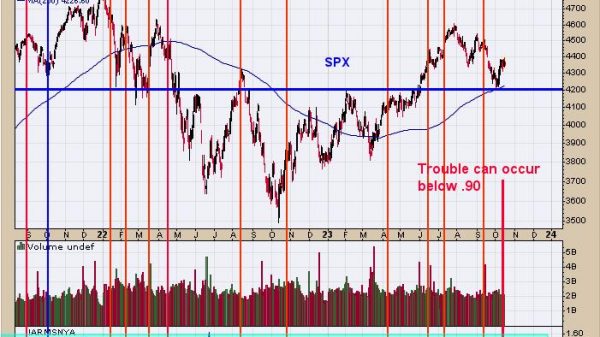
SPX Monitoring purposes: Long SPX 9/28/23 at 4299.70. Gain since 12/20/22: 15.93%. Monitoring purposes GOLD: Long GDX on 10/9/20 at 40.78. In the above...

FOAM ICO (EFIC) Is Coming Soon. Why Is It Trending? In an age where our most critical infrastructures and industries rely heavily on GPS...


Chinese House Property Stocks Face 14-Year Low Chinese property stocks are currently facing their toughest challenge in 14 years. The sector is under immense...


The Treasury Balancing Act: Yield Dynamics and Economic Clues On a crisp Wednesday morning, the US Treasurys displayed a mixed landscape as investors pored...


Stock Market Outlook: Earnings Season Stock markets are constantly in a state of flux, influenced by a myriad of factors such as earnings reports,...


Emerging Market: A Closer Look After Strong China Data Asia’s financial landscape has been an ever-evolving canvas, and recent events are causing ripples that...
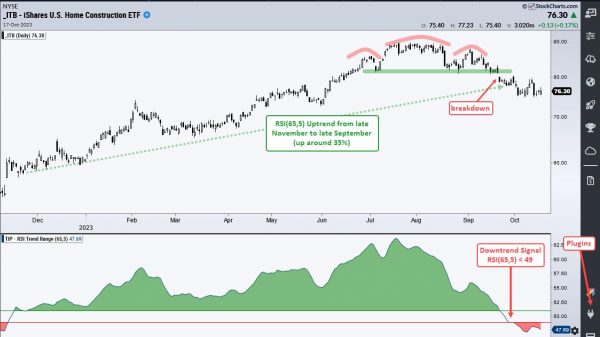
The Home Construction ETF (ITB) led the market the first seven months of the year, but fell on hard times the last two months...