Enthusiasm is needed to drive an uptrend, but sometimes enthusiasm can go too far. That is why technical analysts like to use various sentiment indicators and surveys, in order to see when all the buyers who are going to get in have already done so.
This week’s chart shows some data that not very many analysts pay attention to, which of course makes me more interested in watching it. After all, if I looked at the indicators that everyone looks at, then I would only know what everyone else knows.
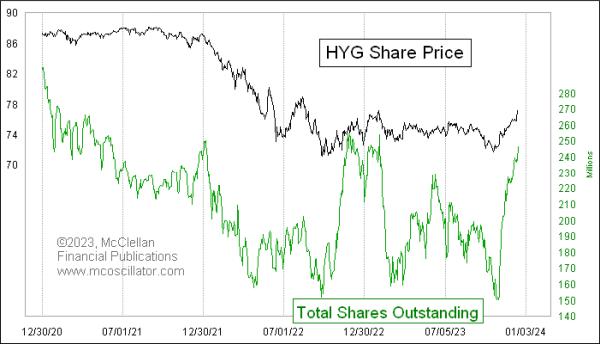
The chart shows the total shares outstanding in HYG, which is the iShares iBoxx $ High Yield Corporate Bond ETF. The way that ETFs are structured means that the number of shares outstanding can expand and contract as more or fewer people are interested in investing in them. Thus the fluctuations in the numbers of shares outstanding can serve as an indication of the public mood toward risk for that particular ETF or fund category.
Right now, that mood is one of enthusiastic acceptance of risk, as the small rise in HYG has led to a 64% rise in its shares outstanding just since the Oct. 31 low point. That is a big swing in enthusiasm for just a small upswing in prices, and it has unfolded rapidly, indicating that investors are eager to get in, not just that they are being pulled in by a price gain in the ETFs shares. Typically, the market likes to punish those who get overly enthusiastic, although the market does not necessarily have to do that right away just because we notice that sentiment condition.
High-yield corporate bonds trade more like stocks than like T-Bonds, and they draw from the same sources of liquidity as the stock market. Because HY bonds are lower-grade investment products, they tend to suffer first when liquidity starts to dry up. For that reason, I like to monitor the A-D Line for those HY Bonds, as referenced in the article linked at the end of this article. It often shows signs of weakness ahead of the stock market, which makes it a useful harbinger of trouble. Right now, that A-D Line is very strong, just as the share price of HYG is strong, and so the message of liquidity is one of continuing strength. If liquidity is so strong that even the marginal types of investments can do well, then it is likely to remain strong for a while longer. So it is a bullish revelation that the HY bonds are doing well.
But it is a troubling revelation that, at the same time, ETF traders are piling so aggressively into HYG, expecting it to keep doing well. That says there is excessive eagerness at the moment, which implies that the market is likely to do what it usually does, i.e. punish that eagerness.
For those who want to track these data on shares outstanding yourselves, you can go to the iShares web page for that fund and click the link for “Data Download” to get an Excel file. It is also available on some quote systems under the symbol $HYG.SO.


