


A recent article on the Business Insider site reported a set of Death Cross/Golden Cross signals on the Dow Jones Industrial Average ($INDU). Specifically, on November 13 the 50-day moving average crossed down through the 200-day moving average, commonly called a Death Cross. Two days later the 50-day moving average crossed back up through the 200-day moving average, commonly called a Golden Cross. I was surprised by this claim because I follow the Dow and these crossovers, and I had not observed such events.
I quickly discovered the problem. The symbol $INDU is the official Dow Jones Industrial Average, but the problem is that the data for this symbol are not adjusted for dividends, as are the data for stocks, mutual funds, and ETFs. In fact, none of data for the major market indexes ($SPX, $NDX, $NYA, $COMPQ, etc.) are adjusted for dividends, so if you want to perform technical analysis on them, it is best to use the corresponding ETF.
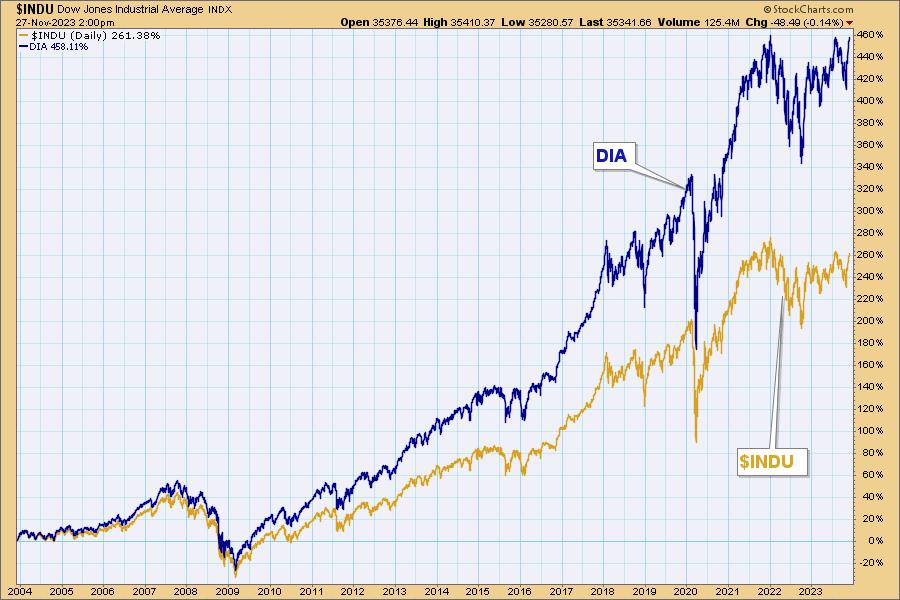
This chart illustrates the point. Adjusting prior data for dividends changes the price index into a total return index by incorporating dividends into the data.
Now here is a chart using $INDU data. Note the whipsaw.
Now here is a chart using the Dow Jones Industrial Average ETF (DIA). The whipsaw never happens.
While the data for major market indexes is not adjusted (probably to avoid confusion regarding historical references), there are data sets other than ETFs available, usually called total return indexes. For example, symbol for the total return index for the Dow is $DJITR. Personally, I prefer the ETF.
Conclusion: When performing technical analysis, be sure that the data is adjusted for distributions (dividends and splits). Charting services like StockCharts.com perform the calculations as a matter of course.
Learn more about DecisionPoint.com:
Watch the latest episode of DecisionPoint on StockCharts TV’s YouTube channel here!
Try us out for two weeks with a trial subscription!
Use coupon code: DPTRIAL2 at checkout!
Technical Analysis is a windsock, not a crystal ball. –Carl Swenlin(c) Copyright 2023 DecisionPoint.com
Disclaimer: This blog is for educational purposes only and should not be construed as financial advice. The ideas and strategies should never be used without first assessing your own personal and financial situation, or without consulting a financial professional. Any opinions expressed herein are solely those of the author, and do not in any way represent the views or opinions of any other person or entity.
DecisionPoint is not a registered investment advisor. Investment and trading decisions are solely your responsibility. DecisionPoint newsletters, blogs or website materials should NOT be interpreted as a recommendation or solicitation to buy or sell any security or to take any specific action.
Helpful DecisionPoint Links:
DecisionPoint Alert Chart List
DecisionPoint Golden Cross/Silver Cross Index Chart List
DecisionPoint Sector Chart List
DecisionPoint Chart Gallery
Trend Models
Price Momentum Oscillator (PMO)
On Balance Volume
Swenlin Trading Oscillators (STO-B and STO-V)
ITBM and ITVM
SCTR Ranking
Bear Market Rules


