SPX Monitoring Purposes: Long SPX 10/27/23 at 4117.37. Gain Since 12/20/22: Over 23%. Monitoring Purposes GOLD: Long GDX on 10/9/20 at 40.78.
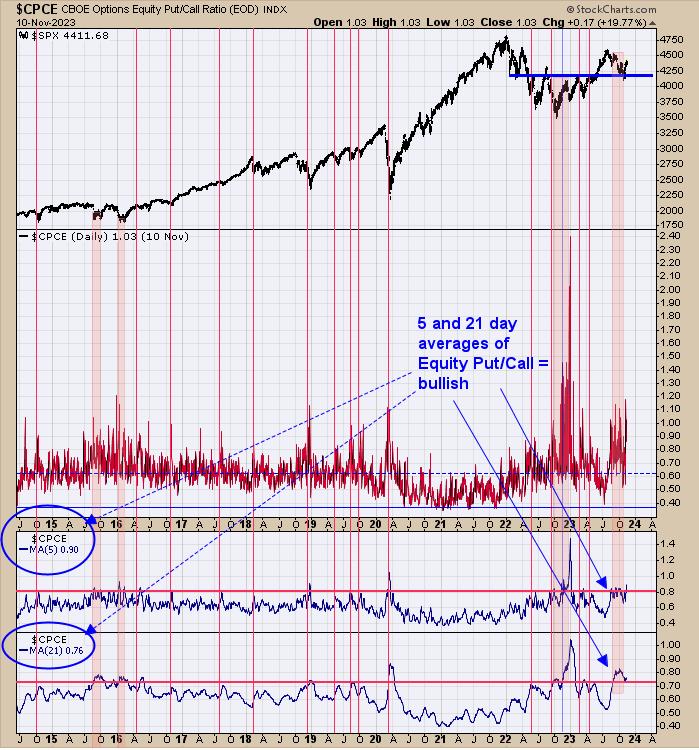
Above is a sentiment indicator which is the CBOE 5- and 21-day equity put/call ratio. The red lines and pink-shaded areas are times when the 5- and 21-day equity put/call ratio reached bullish levels for the market. It’s interesting that the SPX went straight up over the last couple of weeks, while the put/call players lean solidly bearish both on the weekly and monthly timeframe, which in turn is bullish. There could be a consolidation this week, but next week (Thanksgiving week), seasonality leans bullish and, with the put/call ratio remaining in bullish territory, the SPX rally may continue. We are long SPX 10/27/23 at 4117.37.
Join me on TFNN.com Tuesday 3:30 Eastern Time and Thursday 3:20 Eastern Time.
This week is the 10th-worst week of the year for performance and could see a pullback. The bottom window is the 10-day average of the TRIN. Readings near 1.20 and higher are bullish for the market; the current reading is 1.17, which leans bullish. The next higher window is the VIX. Readings below 17 suggests the market is in a trending mode (current reading is 14.62). Also notice that the SPY has made higher highs and the VIX has flipped sideways over the last several days, which is a negative divergence. There is a possibility of a pullback, but 10-day TRIN and pull/put call ratio (page 1) suggests ultimately the market will move higher.
Tim Ord,
Editor
www.ord-oracle.com. Book release “The Secret Science of Price and Volume” by Timothy Ord, buy at www.Amazon.com.
Signals are provided as general information only and are not investment recommendations. You are responsible for your own investment decisions. Past performance does not guarantee future performance. Opinions are based on historical research and data believed reliable; there is no guarantee results will be profitable. Not responsible for errors or omissions. I may invest in the vehicles mentioned above.


