SPX Monitoring Purposes: Long SPX 10/27/23 at 4117.37. Gain Since 12/20/22: Over 17%. Monitoring Purposes GOLD: Long GDX on 10/9/20 at 40.78.
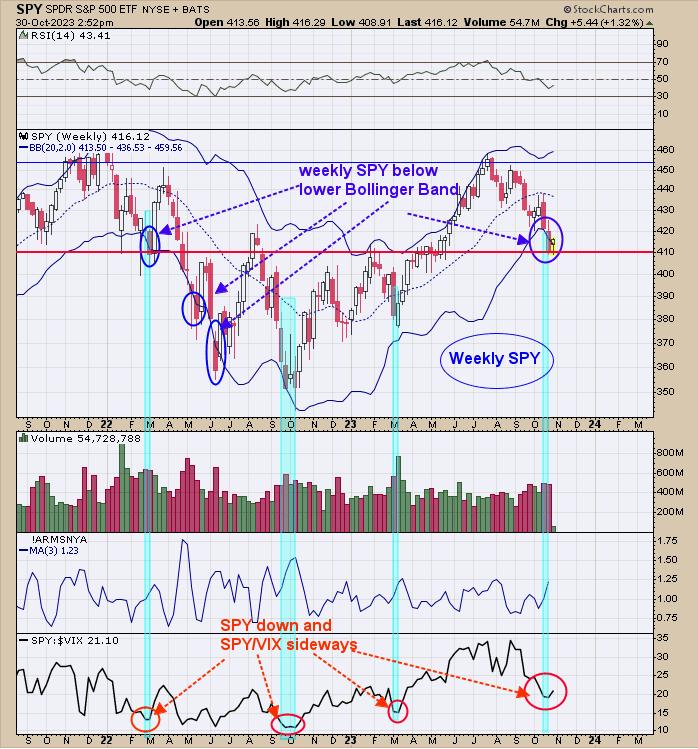
Last Thursday, we said “Above is the weekly SPY, with its Bollinger bands going back nearly three years. Short-term lows have formed when the weekly SPY closed below its lower Bollinger band (circled in blue). The week ends tomorrow, so ideally we would like to see the SPY to not rally and close below the lower Bollinger Band. The bottom window is the weekly SPY/VIX ratio, which has traded sideways so far this week. We marked in light blue other times the SPY was down and this ratio traded sideways. Bullish signs are present.” This trade setup could be working out. The most bullish weekly seasonality period of the year is October 27 to November 3. We are long SPX 10/27/23 at 4117.37.
The bottom window is the “Zweig Breadth Thrust” indicator (ZBT). ZBT has a good chance of triggering in the coming days. A ZBT is triggered when this indicator rallies from below .40 to .60 in 10 or fewer days. ZBT reached .38 last Friday and stands at .43. ZBT would need to reach .60 by November 10 (10 trading days). For that to happen, the market would in general to work higher. ZBT triggers at intermediate-term lows and would be a bullish sign for the market. We noted previous signals on the chart above. There were 3 ZBT signals triggered from the sideways move from April 2022 to April 2023, which suggests a bull run was about to begin (which it did).
Tim Ord,
Editor
www.ord-oracle.com. Book release “The Secret Science of Price and Volume” by Timothy Ord, buy at www.Amazon.com.
Signals are provided as general information only and are not investment recommendations. You are responsible for your own investment decisions. Past performance does not guarantee future performance. Opinions are based on historical research and data believed reliable; there is no guarantee results will be profitable. Not responsible for errors or omissions. I may invest in the vehicles mentioned above.


