The market’s worsening breadth and the lack of a robust bounce on 8/18/23, even as bond yields reversed course after their runaway freight train climb during the week, is worrisome.
On the other hand, the market’s sentiment is souring rapidly, and oversold gauges are closing in on traditional bounce territory. Consider this:
CBOE Put/Call Ratio hit 1.25 on 8/16 – the highest reading in eight months; The CNN Greed Fear Index hit 46 (neutral) on 8/18/23 – a month ago it was at 83 (extreme greed). Readings below 40 signal excessive greed in the market; RSI for the S&P 500 (SPX) is at 34, just shy of the critical 30 oversold reading; and The New York Stock Exchange Advance Decline line (NYAD, see below) closed outside its lower Bollinger Band for the fourth straight day – this is as oversold as it gets.Thus, with rising pessimism and with the market nearing an oversold level, the key to what happens next depends on what type of bounce we see in the next few days. If there is no real strength in the bounce, we may see a renewal of the downtrend.
Bonds Test Secular Bear Market Boundaries
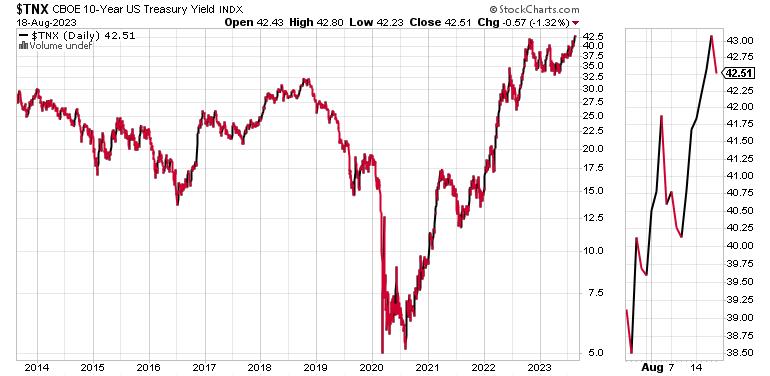
The U.S. Ten Year Note yield (TNX) recently tested the 4.30% yield area, its highest point since late 2022, before turning lower. If TNX breaches this key chart point, bonds may have entered a secular bear market. That won’t be good for stocks.
The long-term chart for TNX shows that yields crossed a meaningful high point (3.25%) area in 2019 before re-entering a bullish phase, due to the pandemic raising the specter of a global depression.
Of course, history has shown that no such thing happened as global central banks hit the digital printing presses.
The U.S. recovered. The jury is still out for Europe. China remained closed too long. Foreign companies moved. Since China’s economy depends on foreign capital to fuel its manufacturing base, the exit of foreign companies resulted in a capital vacuum which is now affecting the Chinese property sector, as seen in the recent bankruptcy of the Evergrande Real Estate conglomerate, China’s largest developer.
Normally, this would be bullish news for U.S. Treasuries. Is this time different?
So Why are Bond Yields Rising?
The pandemic reversed globalization, as lockdowns had unintended consequences. Consider the following:
Companies moved out of China, taking capital out of the Chinese economy; Construction of manufacturing plants and warehouses in the U.S. has increased; while Supply chains have not fully adjusted.New factories built in the U.S. are technology-focused: semiconductors, solar power technology, and electric car parts and batteries. A few factories make building materials, household appliances, furniture, cell phones, or internal combustion engine automobiles.
Ignored are food processing, medical product manufacturing, and other important areas. Normally, these items come from China. But China’s economy is slowing, and capital flight is making operations there difficult for both domestic and foreign companies, creating shortages of everyday products and raising prices.
In the U.S., the skilled labor pool has shrunk. There aren’t enough people farming, making furniture, or processing meat. Those with those skills cost more. Meanwhile, companies looking to build factories in the U.S. are having trouble finding enough skilled construction workers, adding to rising costs and fueling inflation.
The U.S. government continues to pump money into the clean energy economy, flooding the economy with money just as the Fed is trying to tighten conditions. Too many dollars chasing too few goods – the most basic definition of inflation. Capital allocation is unbalanced and inefficient, compounding the problem. Thus, bond traders fear a squeeze in raw materials and skilled labor costs, and the related decreased production of necessary household goods.
In other words, the post-pandemic period is turning into one where inflation is becoming structural. If TNX moves above 4.3%, this notion will be all but confirmed.
Smart Money Update: Was that the Top in Housing Stocks?
We may have seen the top in the housing stocks, although the jury is still out on this. I’ve been bullish on homebuilders for quite a long time, but, unless something improves quickly, the best days for this group may be behind us.
The SPDR S&P Homebuilder crashed and burned on 8/17/23, slicing through its 50-day moving average like butter. Moreover, there was no real bounce to speak of on the next day, which is what’s usually happened in the past twelve months after heavy bouts of selling. Accumulation/Distribution (ADI) and On Balance Volume (OBV) both rolled over aggressively, both negative signs suggesting money is moving out in a hurry.
The key is if and how the sector bounces back. Still, the supply shortages in the housing market will resurface as the kindling required to reignite a rally in XHB. Meanwhile, money is decidedly finding a home in the energy sector, specifically in oil and oil service stocks (OIH).
Patient investors may eventually benefit from the uranium market, as nuclear power continues to slowly become a viable alternative in the search for clean energy sources in the face of the cuts in oil and natural gas production, as displayed in the accelerating downward path of the weekly oil rig count. There are now 136 fewer active rigs in the U.S. compared to the same period in 2022.
A sector, which is bullishly being ignored by many traders, is uranium. But the shares of the Global X Uranium ETF (URA) are under steady accumulation. I recently discussed how to spot the smart money’s footprints and how to turn them into profits. URA, in which I own shares, is featured in the video. You can get the full details here.
Do you own homebuilder stocks? What should you do with your energy holdings? Get answers at Joe Duarte in the Money Options.com. You can have a look at my latest recommendations FREE with a two-week trial subscription. And for an in-depth review of the current situation in the oil market, homebuilders and REITS, click here.
Will NYAD Finally Bounce? NDX and SPX Approach Oversold Levels
Given the drubbing stocks took last week and the oversold reading on RSI for the New York Stock Exchange Advance Decline line, you’d think we’d get a bigger bounce when bond yields turned lower on Friday. No such thing happened. That’s worrisome.
The long term trend for stocks remains up, but the short- and intermediate-term trends are in question, as NYAD remained below its 20-day and 50-day moving averages and may still be headed for a test of its 50-day, and perhaps the 200-day, moving average.
The Nasdaq 100 Index (NDX) is very oversold after breaking below its 50-day moving average the 15,000 level. Accumulation/Distribution (ADI) and On Balance Volume (OBV), remain weak, as short sellers are active and sellers are overtaking buyers. Let’s see what type of bounce we get.
The S&P 500 (SPX) looks just as bad, remaining below 4500, its 20-day and its 50-day moving averages. Both ADI and OBV are negative. Support is now around the 4300 area.
VIX Remains Below 20
VIX rolled over at the end of last week without taking out the 20 level. This is good news. A move above 20 would be very negative as it would signal that the big money is finally throwing in the towel on the uptrend.
When the VIX rises, stocks tend to fall, as rising put volume is a sign that market makers are selling stock index futures to hedge their put sales to the public. A fall in VIX is bullish, as it means less put option buying, and it eventually leads to call buying, which causes market makers to hedge by buying stock index futures. This raises the odds of higher stock prices.
Liquidity Remains Stable
Liquidity is stable, but may not remain so for long if the current fall in stock prices accelerates. The Secured Overnight Financing Rate (SOFR), which recently replaced the Eurodollar Index (XED) but is an approximate sign of the market’s liquidity, just broke to a new high in response to the Fed’s move. A move below 5.0 would be more bullish. A move above 5.5% would signal that monetary conditions are tightening beyond the Fed’s intentions. That would be very bearish.
To get the latest information on options trading, check out Options Trading for Dummies, now in its 4th Edition—Get Your Copy Now! Now also available in Audible audiobook format!
#1 New Release on Options Trading!
Good news! I’ve made my NYAD-Complexity – Chaos chart (featured on my YD5 videos) and a few other favorites public. You can find them here.
Joe Duarte
In The Money Options
Joe Duarte is a former money manager, an active trader, and a widely recognized independent stock market analyst since 1987. He is author of eight investment books, including the best-selling Trading Options for Dummies, rated a TOP Options Book for 2018 by Benzinga.com and now in its third edition, plus The Everything Investing in Your 20s and 30s Book and six other trading books.
The Everything Investing in Your 20s and 30s Book is available at Amazon and Barnes and Noble. It has also been recommended as a Washington Post Color of Money Book of the Month.
To receive Joe’s exclusive stock, option and ETF recommendations, in your mailbox every week visit https://joeduarteinthemoneyoptions.com/secure/order_email.asp.


