Traders have a tendency to “think” in their own currencies, which is a natural human action. But it is worth paying attention to how other traders may think, because how they see prices can affect their behavior in ways we might not be seeing through our own lenses.
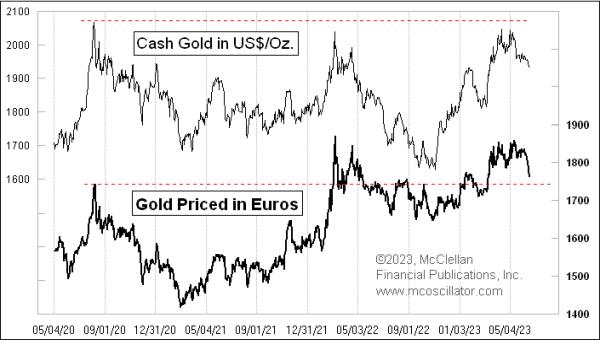
In the USA, we think in dollars, and so gold traders have noticed how prices have been thus far unable to climb above the $2067/oz level, which marked the high for spot gold prices back on August 6, 2020. But the gold traders who think in euros see it differently. For them, that August 2020 high was exceeded back in March 2022. So they would naturally not understand anyone asserting that the August 2020 high price level still matters as a resistance level. But on this current pullback, the euro-based gold traders might see it as a potential support level.
The chart also looks different to traders who think in the Chinese yuan currency.
The USA is the richest country in the world, but it only has about 334 million residents. In China, there are more than 4 times that number, people who are potential gold traders that think in yuan (also known as the renminbi). While the dollar price of gold has now broken the steep rising bottoms line, the same line drawn on the price in yuan is still fully intact. So is gold breaking down, or not?
A similar question can be posed for those who look at gold prices measured in Japanese yen.
Here, we see that there is no breakdown, no struggling to get up above the August 2020 high. The yen price of gold shows just a solid steady uptrend. The weakness of the yen over the last 3 years means that each yen has less value than it used to have, and so it takes more of them to buy something (like gold).
So which chart is right? They all are, even though they seem to be saying totally different things. And thus, no single one set of prices is “right”. A dollar-based gold trader would be quite reasonably concerned about the breakdown in the chart. But yen-based and yuan-based traders are congratulating themselves on being so wise as to have bought gold under such fortuitous conditions.
Where this phenomenon gets complicated is when chartists come to think of prices arriving at a support or resistance level. It is common for chartists to draw horizontal lines from prior highs or lows, expecting that the sellers or buyers who sold or bought at those levels will do so again if prices return to those levels. Such is the case with the dollar price of gold getting back up close to revisiting that $2067/oz level seen in August 2020. Dollar-based traders think that gold encountered “key resistance” at that prior high. But dollar-based traders are only a small fraction of the world’s gold traders, and the rest of the gold traders around the world had no awareness at all of that August 2020 prior high being very significant to them at all.
It is for this reason that I try to stay away from thinking that a static support or resistance level is ever going to matter on a chart of the dollar price of gold. It looks so different to so many other traders that the supposed importance of that prior high or low on a dollar priced chart is just not going to matter to them, and they will not exhibit behaviors expected by someone staring at the dollar priced chart. And it gets further complicated if one looks at the spot price of gold or the futures price, since contango can introduce price differences into futures price charts, especially now that we have higher short-term interest rates. So a logical support or resistance level on a continuation futures chart (stringing together lots of different contract months) can look different from what the spot price chart looks like, potentially ruining any chart pattern interpretation one might try to make.
I realize that this assertion goes against the thinking of a lot of technical analysts, and I am okay with that.


