The S&P 500 recently moved above its February high to extend its uptrend, but all is not well under the surface. Fewer stocks are participating in the May advance and a key breadth indicator formed a bearish divergence. Bearish divergences form when price records a higher high and an indicator fails to confirm by forming a lower high. Bearish divergences in breadth indicators show that participation is waning. Fewer stocks are participating in an advance. This undermines an advance and makes the market vulnerable to a decline going forward. This was covered in Wednesday’s report and video at TrendInvestorPro.
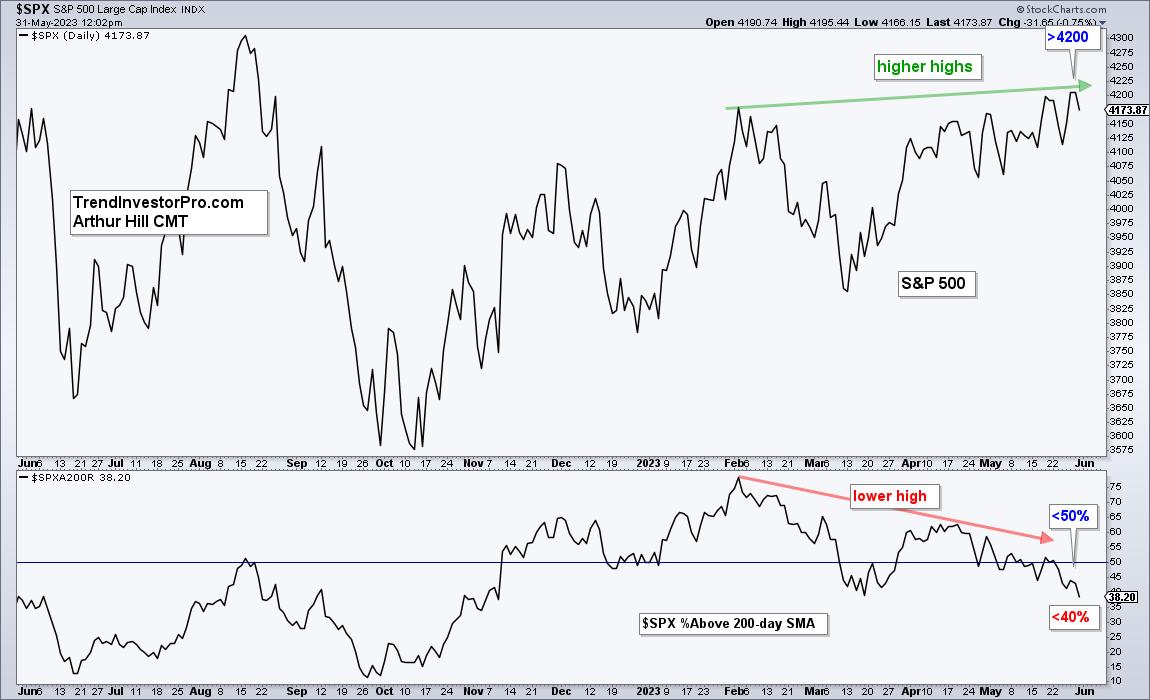
The chart below shows the S&P 500 (main window) forging higher highs from February to late May (green arrow-lines). Higher highs are positive, but the trouble starts when we look under the hood. The indicator window shows the percentage of S&P 500 stocks above the 200-day SMA. This indicator exceeded 75% in early February, but did not make it back above 65% in April. The red arrow-line shows a lower high from February to April and this is a bearish divergence. Fewer stocks are participating in the advance.
Not only is participation waning, but more stocks are in downtrends than uptrends. The S&P 500 closed above 4200 on Friday and Monday. Despite another higher high, fewer than 50% of stocks made it above their 200-day SMAs. Currently, some 38.2% of stocks are above their 200-day SMAs and this means 61.8% are below. The majority of stocks in the S&P 500 are in downtrends and this argues for caution going forward.
TrendInvestorPro covered waning breadth and more in Wednesday’s report and video. This month we introduced a quantified trend-momentum strategy that trades stock-based ETFs. The final part will be published on Thursday, along with a signal table. Click here for immediate access.
Normalized-ROC, the Trend Composite, ATR Trailing Stop and nine other indicators are part of the TrendInvestorPro Indicator Edge Plugin for StockCharts ACP. Click here to take your analysis process to the next level.
—————————————


