In gold futures, we were looking for a correction to around $1940 an ounce.
The June contract fell to $1932. Now, it closed on the exchange at $1958. Plus, it had a new 60-day low and potential reversal pattern.
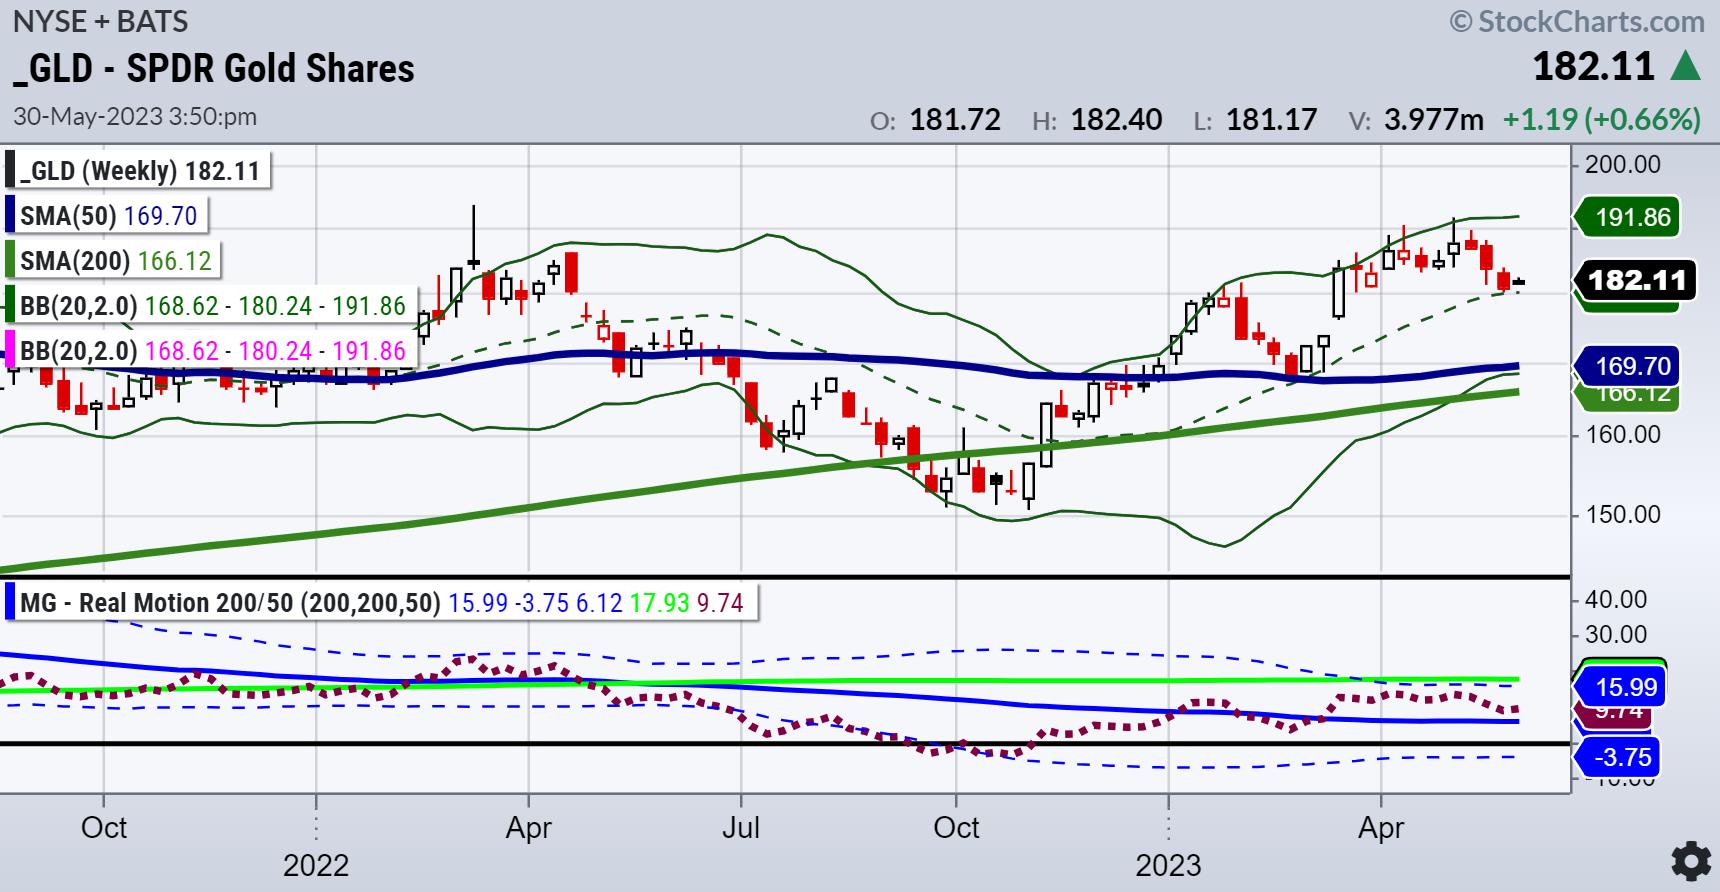
The Gold ETF (GLD) has begun this week trading inside the range of Friday, and with a very narrow trading range at that. That means a pause and uncertainty. Our Real Motion Indicator shows support at its blueline or 50-DMA.
Does that mean it’s time to get in, or, if already in, to buy more?
The Gold Miners ETF (GDX) is a holding in 2 of our quant models: Sector Rotation and GEMS.
Sector Rotation entered in March. This model uses our trend strength indicator to measure performance and gives it a ranking. Currently, the conservative model has the ETF ranked number 5.
The GEMS model uses a component of sector rotation. Similarly, GDX is ranked number 5.
On the daily chart, our Real Motion indicator sits right on its 50-DMA. Furthermore, the price of GDX is above the 50-DMA. Momentum needs to catch up and price, ultimately, needs to return over the 200-DMA (green line).
The Silver ETF (SLV) is in our GEMS model as part of the global Macro algo. That, too, had an inside and narrow range trading day. SLV’s momentum sits on support, while the price is above it.
Based on our quant models (pure math) and our discretionary read of these charts (math and art), it appears the correction in all 3 (GLD, GDX, SLV) could be done. That means the risk is super tight as these recent support levels should hold. It also means that, should they get follow through to the upside, it is possible to see a much bigger rally than the one in early April.
For more detailed trading information about our blended models, tools and trader education courses, contact Rob Quinn, our Chief Strategy Consultant, to learn more.
“I grew my money tree and so can you!” – Mish Schneider
Get your copy of Plant Your Money Tree: A Guide to Growing Your Wealth and a special bonus here.
Follow Mish on Twitter @marketminute for stock picks and more. Follow Mish on Instagram (mishschneider) for daily morning videos. To see updated media clips, click here.
Mish in the Media
Mish discusses how AI is being used to invest in this article for BNN Bloomberg.
Mish joins Rajeev Suri of Orios Venture Partners to discuss the implications of the debt ceiling deal in this video on LinkedIn.
Mish discusses the commodities to watch in this video from CMC Markets.
In this appearance on Business First AM, Mish covers business cycles, plus where to go for trades once the dust settles.
Mish and Caroline discuss profits and risks in a time where certain sectors are attractive investments on TD Ameritrade.
Powell eyes a pause, Yellen hints at the need for more rate hikes, and debt ceiling talks face challenges… what a way to end the week, as Mish discusses on Real Vision’s Daily Briefing for May 19th.
Mish walks you through the fundamentals and technical analysis legitimizing a meme stock on Business First AM.
Coming Up:
May 31st: Twitter Spaces 8am ET with Mario Nawfal and Singapore Radio with Kai Ting 6:05pm ET MoneyFM 89.3
June 1st: Wolf Financial Twitter Spaces 1pm ET
June 2nd: Yahoo Finance
ETF Summary
S&P 500 (SPY): 23-month MA 420 the dance. Russell 2000 (IWM): 170 support, 180 resistance. Dow (DIA): 327-333 trading range for the week to hold or break. Nasdaq (QQQ): Opened on the highs, closed on the intraday low-needs to hold 348.50 to prevent a reversal top. Regional Banks (KRE): Did the initial damage, now sidelining. Semiconductors (SMH): No doubt she is showing expansion. Transportation (IYT): Like to see this hold 220 this week. Biotechnology (IBB): 121-135 range. Retail (XRT): 56.00 the 80-month MA, while momentum is at least flatlining.Mish Schneider
MarketGauge.com
Director of Trading Research and Education


