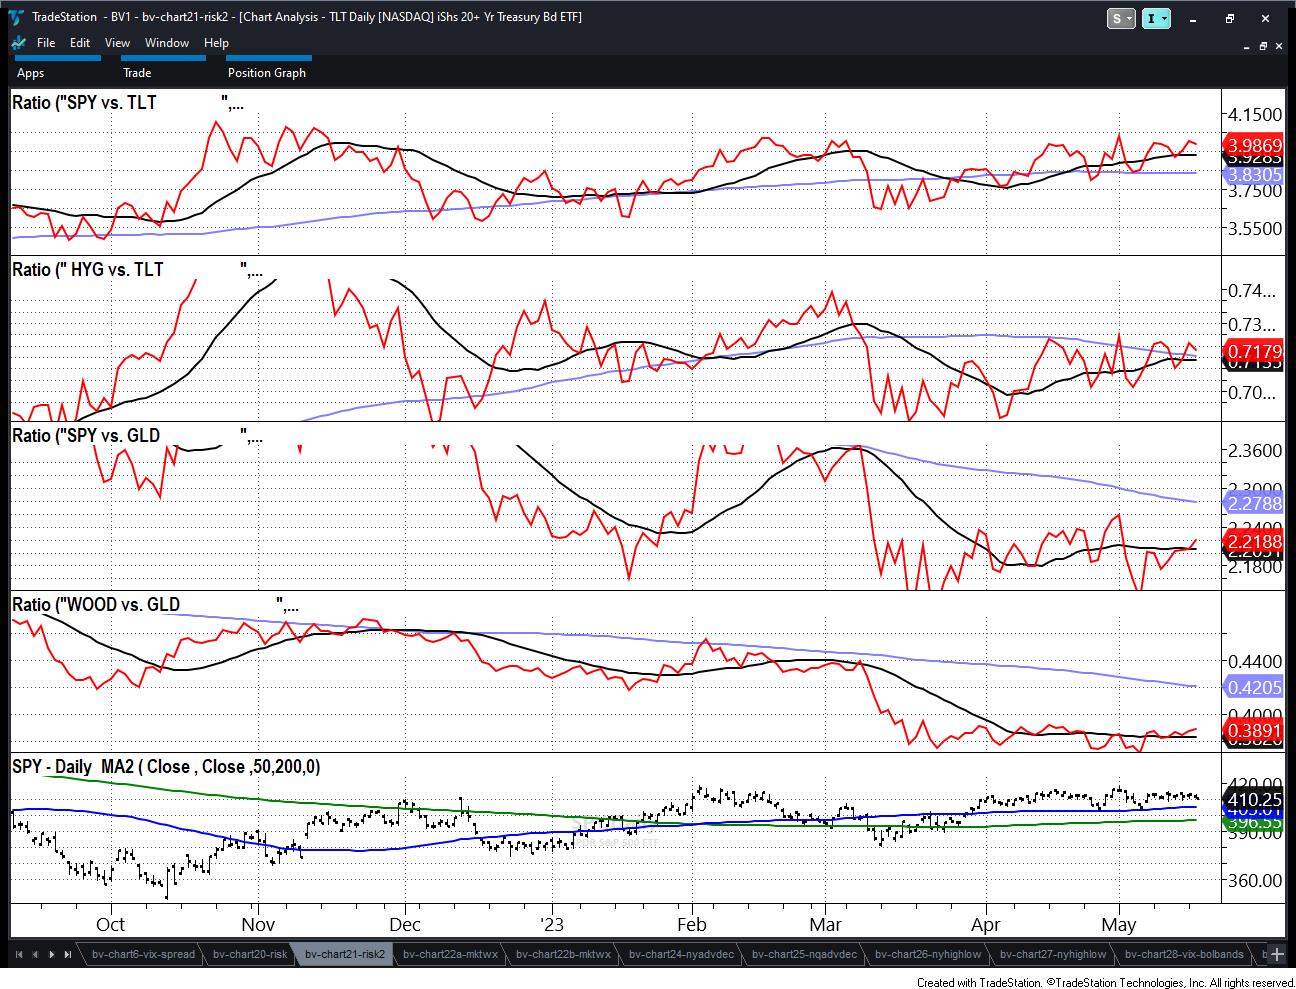
The four ratio indicators track key intermarket relationships which identify risk on/off market conditions. These indicators can be used together to confirm or identify the strength of the core risk on/off indicator, which is the S&P 500 v. Utilities.
These charts come from our Big View product, which is superior in assessing market internals, sentiment, sector and world views, picks and pans plus the health of the Economic Modern Family. As clearly illustrated, all the ratios are flashing 100% risk on.
Is it time to put your cash to work?
The bottom of the recent trading range appears to be holding at this point. And what led to more confidence in our recent picks (USO, LIT, GME, 3 most recent examples) was the ratio between SPY and Long Bonds (TLT). I have been vocal on media about junk bonds (HYG) versus long bonds (TLT); when high yield outperforms long bonds, it is hard to make a case for recession.
Furthermore, we have mentioned that gold appeared to be in for a rest. As you can see, SPY and WOOD are both outperforming gold–a good thing for the stock market. These ratios gave us a comfort level, as bulls want SPY in the lead.
However, let us not lose sight of the ratios; for first, they could flip. Secondly, the trading range is still very much so a trading range. Finally, the small caps (IWM) may have gotten a pass for now, but still need to prove a lot more. In fact, we continue to believe that the economy may not contract further, which is still quite different than predicting the economy can grow.
Stagflation is still a thing.
For more detailed trading information about our blended models, tools and trader education courses, contact Rob Quinn, our Chief Strategy Consultant, to learn more.
IT’S NOT TOO LATE! Click here if you’d like a complimentary copy of Mish’s 2023 Market Outlook E-Book in your inbox.
“I grew my money tree and so can you!” – Mish Schneider
Get your copy of Plant Your Money Tree: A Guide to Growing Your Wealth and a special bonus here.
Follow Mish on Twitter @marketminute for stock picks and more. Follow Mish on Instagram (mishschneider) for daily morning videos. To see updated media clips, click here.
Mish in the Media
Mish provides a roundup of the commodities and currency pairs to watch this week on CMC Markets.
Mish explains how the Retail ETF is at a critical level on Business First AM.
In this video, Mish walks you thru the Dollar, Euro, GBP, Gold, Silver and more.
Mish walks you through the fundamentals and technical analysis legitimizing a meme stock on Business First AM.
In this appearance on Fox Business’s Making Money with Charles Payne, Mish and Charles discuss if economy has contracted enough with support in place, and present 3 stock picks.
Mish covers the trading range and a few of her recent stock picks on Business First AM.
In this appearance on Real Vision, Maggie Lake and Mish discuss current state of the market, from small caps to tech to gold.
Coming Up:
May 18th: Presentation for Orios VC Fund, India
May 19th: Real Vision Analysis
May 22nd: TD Ameritrade
May 31st: Singapore Radio with Kai Ting 6:05pm ET MoneyFM 89.3.
June 2nd: Yahoo Finance
ETF Summary
S&P 500 (SPY): 23-month MA 420, support 410 Russell 2000 (IWM): 170 support, 180 resistance. Dow (DIA): 336 the 23-month MA. Nasdaq (QQQ): 328 cleared or the 23-mont MA-now its all about staying above. Regional Banks (KRE): 42 now pivotal resistance, 37 support. Semiconductors (SMH): 23-month MA at 124, now more in the rearview mirror. Transportation (IYT): 202-240 biggest range to watch. Biotechnology (IBB): 121-135 range to watch from monthly charts. Retail (XRT): 59.74 held, so now we watch the 50-DMA at 62.00.Mish Schneider
MarketGauge.com
Director of Trading Research and Education


