


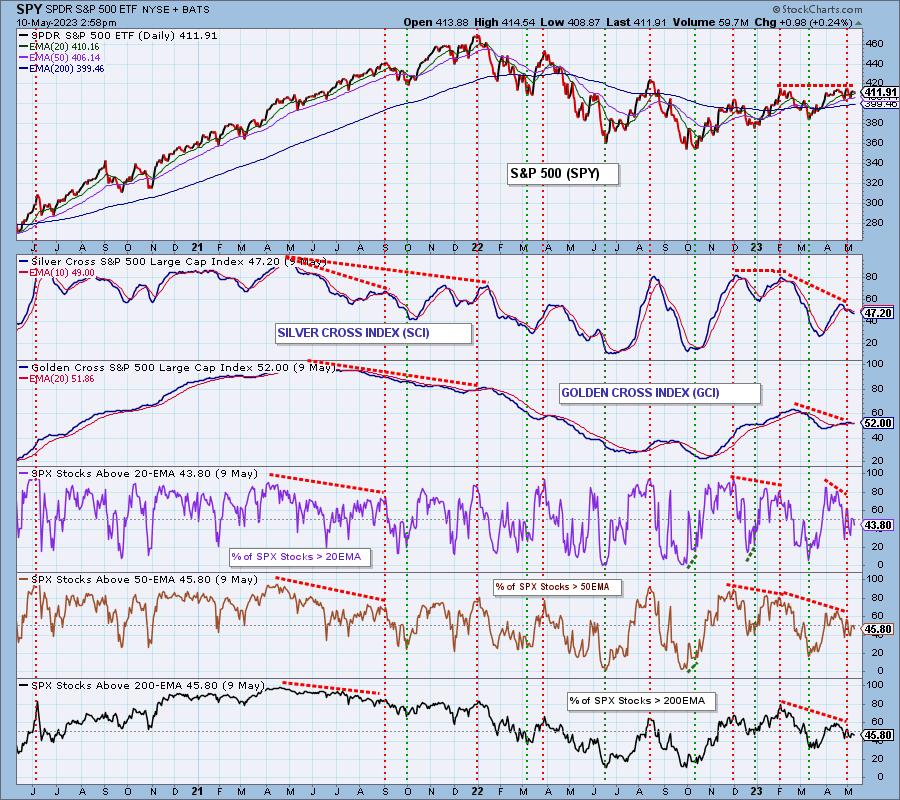
When we talk about “participation,” we are referring to the number of stocks actually taking part in a given market move. Presently, we are looking at the rally from the October lows and the indicators we use to assess it. First, we have our Silver Cross Index (SCI), which shows the percentage of stocks in the S&P 500 that have their 20-day EMA above their 50-day EMA. This configuration is an intermediate-term BUY Signal, and we can see that the SCI currently reads 47 percent. Note that the SCI reading at the February price top was about 80 percent, so we have a double price top with a severe SCI negative divergence.
We have a similar situation with the Golden Cross Index (GCI), which shows the percent of stocks with the 50-day EMA above the 200-day EMA, a long-term BUY Signal. At 52 percent, it reads a bit higher than the SCI, but it is a slower moving indicator. Nevertheless, it too has negative divergence against the two price tops.
The remaining three panels show the percent of stocks in the index with price above their 20-, 50-, and 200-day EMAs. They are all reading in the 40 percent range, and are all displaying negative divergences. All this evidence tells us that participation is narrowing with fewer stocks supporting the price advance.
Conclusion: Last Friday’s rally fueled hopes that the rally from the October lows would be continuing, but fading participation shows severe erosion of the technical foundation, and a rally continuation seems highly unlikely.
Learn more about DecisionPoint.com:
Watch the latest episode of DecisionPoint on StockCharts TV’s YouTube channel here!
Technical Analysis is a windsock, not a crystal ball. –Carl Swenlin(c) Copyright 2023 DecisionPoint.com
Helpful DecisionPoint Links:
DecisionPoint Alert Chart List
DecisionPoint Golden Cross/Silver Cross Index Chart List
DecisionPoint Sector Chart List
DecisionPoint Chart Gallery
Trend Models
Price Momentum Oscillator (PMO)
On Balance Volume
Swenlin Trading Oscillators (STO-B and STO-V)
ITBM and ITVM
SCTR Ranking
Bear Market Rules
DecisionPoint is not a registered investment advisor. Investment and trading decisions are solely your responsibility. DecisionPoint newsletters, blogs or website materials should NOT be interpreted as a recommendation or solicitation to buy or sell any security or to take any specific action. l


