


We decided that it was time to come up with a name for Silver Cross Index and Golden Cross Index crossovers their signal lines. We’ve noticed that Silver Cross Index crossovers are excellent flags to intermediate-term changes in direction.
We’ve decided to name these crossovers “Shifts”. A “Bear Shift” for a downside crossover the signal line and a “Bull Shift” for an upside crossover the signal line. These crossovers ‘shift’ the character of an index, sector or industry group from bullish to bearish or vice versa.
Today we had a Bear Shift on the SPY, SP600 (IJR), Nasdaq Composite (ONEQ), Dow Industrials (DIA) and the SP100 (OEX). The Nasdaq 100 (NDX) has already seen a Bear Shift of the Silver Cross Index.
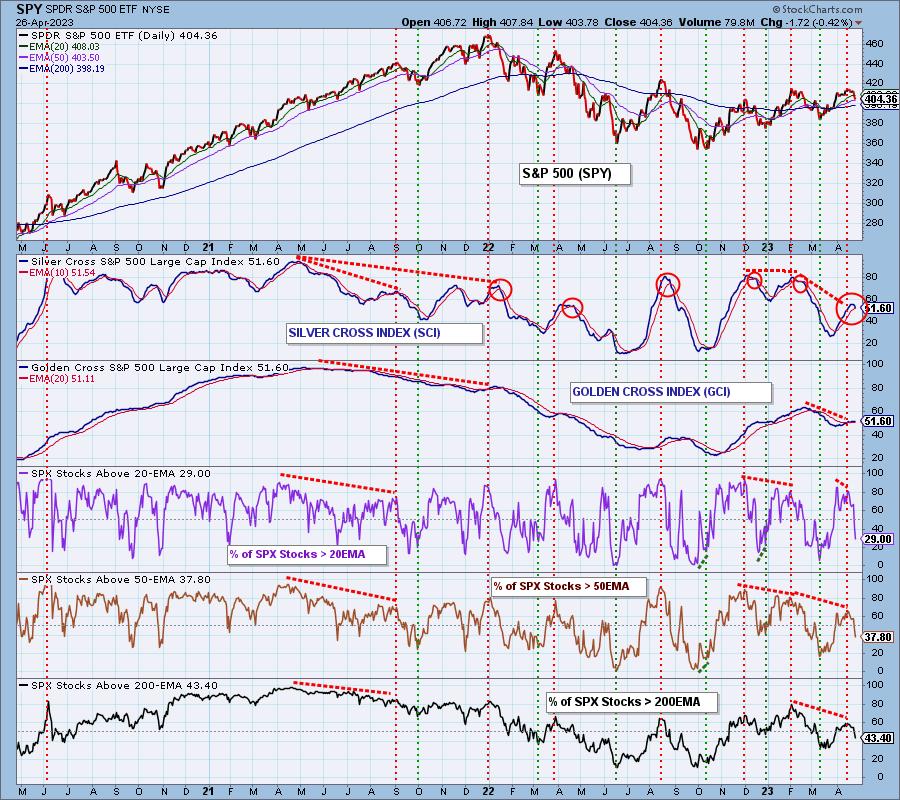
On the chart below we’ve marked some of the most recent Silver Cross Index (SCI) crossovers on the SPY. Remember we use a vertical red dotted line to indicate major market tops and a green vertical dotted line to denote major market bottoms. These downside Bear Shifts have been quite prescient.
With participation dropping off the map for %Stocks > 20/50/200-day EMAs, the Silver Cross Index will continue to decline as it measures how many stocks have a 20-day EMA above their 50-day EMA. Therefore, those %Stocks > 20/50-day EMAs need to at least be close to the Silver Cross Index percentage in order to see upside movement.
Conclusion: Direction changes are important on the Silver Cross and Golden Cross Indexes, but crossovers are particularly important. Today’s Silver Cross Index “Bear Shift” suggests we are in for more than a short-term decline.
Learn more about DecisionPoint.com:
Watch the latest episode of DecisionPoint on StockCharts TV’s YouTube channel here!
Technical Analysis is a windsock, not a crystal ball. –Carl Swenlin(c) Copyright 2023 DecisionPoint.com
Helpful DecisionPoint Links:
DecisionPoint Alert Chart List
DecisionPoint Golden Cross/Silver Cross Index Chart List
DecisionPoint Sector Chart List
DecisionPoint Chart Gallery
Trend Models
Price Momentum Oscillator (PMO)
On Balance Volume
Swenlin Trading Oscillators (STO-B and STO-V)
ITBM and ITVM
SCTR Ranking
Bear Market Rules
DecisionPoint is not a registered investment advisor. Investment and trading decisions are solely your responsibility. DecisionPoint newsletters, blogs or website materials should NOT be interpreted as a recommendation or solicitation to buy or sell any security or to take any specific action.


